Search “load tester” and you’ll drown in carbon-pile diagnostics and car-battery clamp meters. That’s not an accident – roughly 22,200 people search that term every month, and most of them are checking whether their alternator is dying. This guide is about the other kind of load tester: the engineer who makes sure your checkout API doesn’t fall over at 3,000 concurrent users on Black Friday.
If you’re reading this, you probably already know the basics of what load testing is. What you don’t have is a clear answer to the harder questions: Is “load tester” even a real job title, or just a tool category? How do you get from manual QA into this field without a computer science PhD? Which skills actually move the salary needle? And how do you avoid the trap of learning a proprietary scripting language that locks you into one vendor’s ecosystem for the rest of your career?
Here’s what you’ll walk away able to do: disambiguate the role from its adjacent disciplines, map a salary-banded path from junior tester to senior performance engineer, write a runnable JavaScript load test, diagnose bottlenecks layer by layer with a decision tree, and wire automated performance gates into a CI/CD pipeline. Less theory, more things you can paste into a terminal. Ready?
- Load Tester vs. Performance Engineer vs. SRE: Clearing Up the Confusion
- What a Software Load Tester Actually Does All Day
- Essential Skills for Load Testers in 2025
- The Bottleneck Detection Playbook: From Symptom to Root Cause
- Choosing Load Testing Tools Without Getting Locked In
- Writing Your First JavaScript Load Test
- Integrating Performance Testing into CI/CD
- Career Path: From Manual QA to Senior Performance Engineer
- Certifications & Closing the Training Gap
- Hiring a Load Tester: A Quick Checklist for Managers
- References
Load Tester vs. Performance Engineer vs. SRE: Clearing Up the Confusion
The titles overlap, the job descriptions contradict each other, and recruiters use them interchangeably. Let’s fix that.
Is ‘Load Tester’ a Job Title or a Tool? (And Why Google Gets Confused)
It’s both – and that’s the source of half the confusion. “Load tester” refers to (a) a person whose job is designing and running load tests, and (b) the software they use to generate that load, such as a platform like WebLOAD that spins up thousands of virtual users against your endpoints. Add the unrelated electrical/automotive device sharing the name, and you’ve got a three-way homograph that scatters search intent and muddies every career-advice article on the topic.
For clarity: throughout this guide, “load tester” means the person, and “load testing tool” or “platform” means the software. When you tell a recruiter you’re a load tester, expect to clarify which meaning you intend at least once.
The Role Spectrum: From Test Executor to System Designer
Think of these roles as a continuum from activity to discipline. At one end sits the activity: running a 5,000-VU spike test, capturing p95 latency, and filing a report. At the other end sits the discipline of performance engineering – deciding, before a line of code ships, that “the checkout service must hold p99 under 200ms at 10,000 concurrent sessions” is a hard architectural requirement, then designing the system to meet it.
This is the distinction users explicitly search for: performance testing is something you do; performance engineering is a way you build. Academic programs like MIT’s Performance Engineering of Software Systems treat the discipline with the same rigor as algorithms or systems design – it’s about predictable behavior under load, not just measuring it after the fact. A load tester validates; a performance engineer shapes the thing being validated.
Quick-Reference Comparison Table
| Dimension | Manual QA | Load Tester | Performance Engineer | SRE |
|---|---|---|---|---|
| Primary focus | Functional correctness | Validating system behavior under load | Designing systems to meet performance targets | Production reliability & operations |
| Scope of ownership | Test cases, defect reports | Test scripts, load profiles, NFR validation | Architecture decisions, capacity models | Error budgets, SLOs (e.g., 99.9% availability) |
| Typical tooling | Test case managers | Load testing platforms, APM | Profilers, load tools, observability stacks | Monitoring, incident tooling, IaC |
| Typical seniority | Entry to mid | Mid | Mid to senior | Senior |
The SRE row is where many people get tangled. Site Reliability Engineering, as defined in Google’s SRE practices, is fundamentally about running reliable production services using error budgets and Service Level Objectives [1]. An SRE might commission a load test, but they own the production reliability outcome, not the test artifact. The formal performance-testing role, meanwhile, has a recognized definition through the ISTQB Performance Testing certification [2], which anchors it firmly in the software-testing taxonomy rather than operations.
What a Software Load Tester Actually Does All Day
Forget the bullet-list job description. Here’s how a Tuesday actually goes.
The morning starts in the APM dashboard, not the load tool. You’re reviewing the last 24 hours of production traffic for a payments service that’s been flagged in a sprint planning note. The numbers tell a story: the checkout API holds p95 at 320ms comfortably until about 3,000 concurrent users, then the curve bends – p95 climbs past 800ms and error rates creep from 0.1% toward 2%. That inflection point is your test scenario. You’re not guessing at synthetic load; you’re modeling a workload that mirrors what the production traffic pattern already showed you.
Next comes script development. The team just shipped a new “saved cards” feature, so the existing test script needs updating. You capture a HAR file from a real browser session, then build a parameterized script that replays the captured HTTP flow – but with dynamic session tokens and correlated CSRF values pulled from each response rather than hard-coded. Correlation is the unglamorous craft here: miss one dynamic token and your virtual users all fail authentication at step three, and you’ll waste an afternoon wondering why throughput collapsed.
By late morning you’re executing in a cloud-based test environment, ramping from 500 to 4,000 virtual users over 20 minutes. You watch the live dashboard alongside the APM view, correlating response times against CPU utilization, heap growth, and database connection-pool saturation. When p99 spikes, you want to know immediately whether it’s the app tier or the database starving for connections.
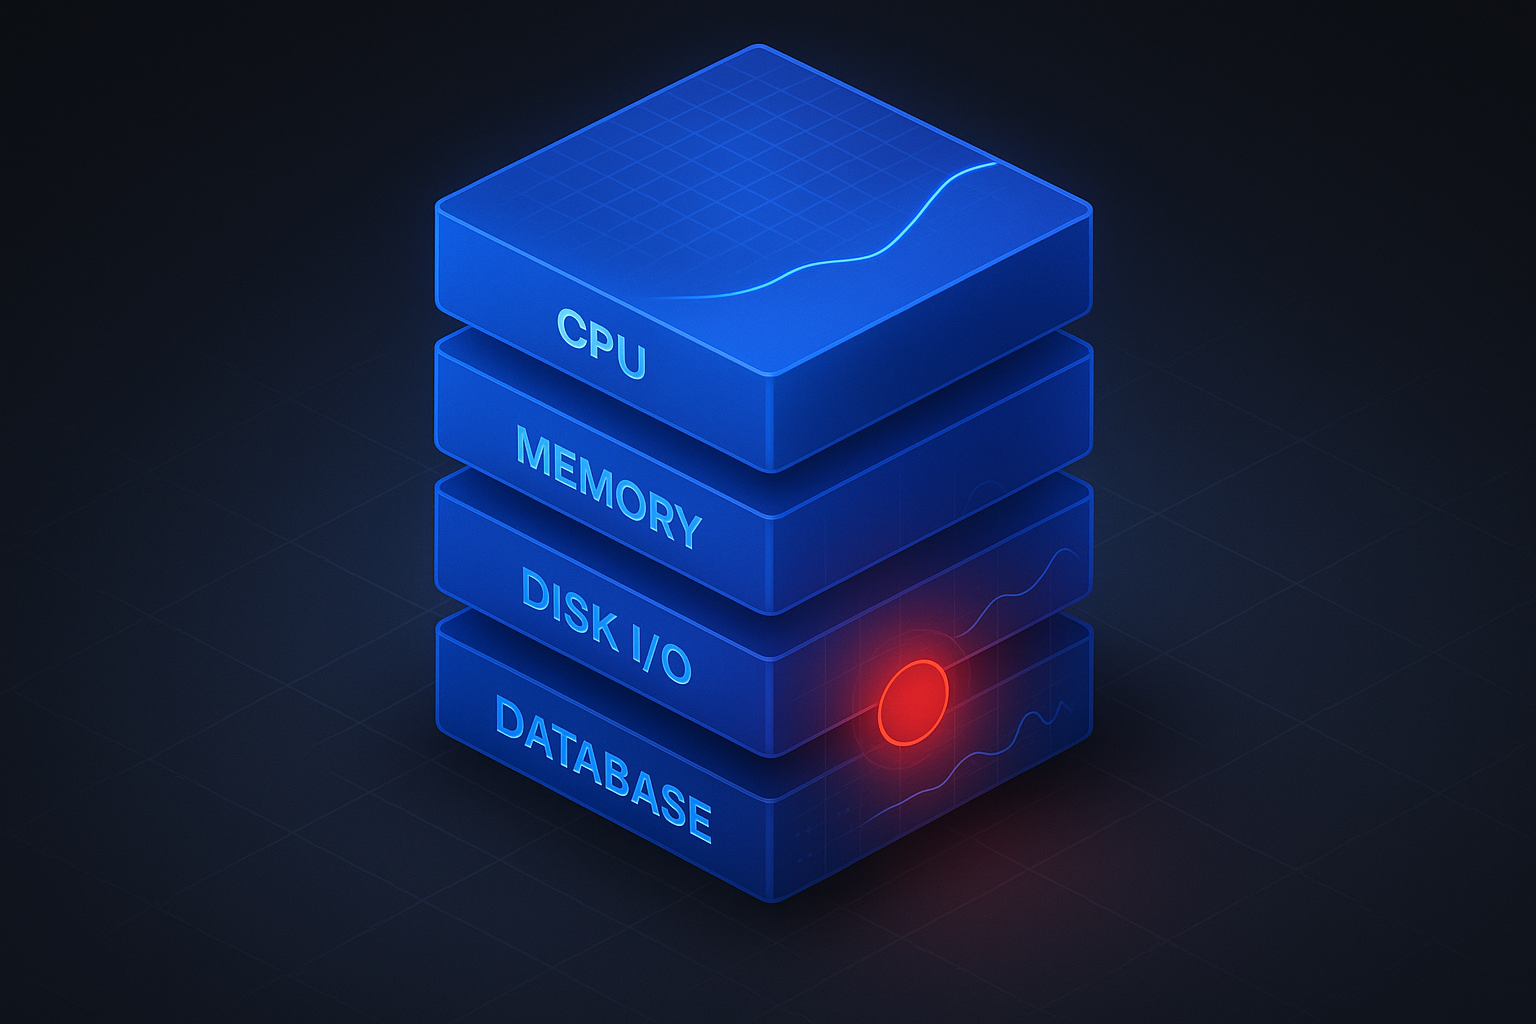
The afternoon is analysis and storytelling. A sanitized load-test report goes to stakeholders – not a wall of raw numbers, but the headline: “Checkout sustains target SLA up to 2,800 users; beyond that, the connection pool exhausts and latency triples. Recommend raising max-pool from 50 to 120 and re-testing.” You document the new performance baseline and the regression threshold that future CI/CD runs will enforce. Then you collaborate with two developers on the fix. That last part – translating a percentile curve into a decision someone acts on – is what separates a tester who runs tools from an engineer who moves the product.
Essential Skills for Load Testers in 2025
Pulling from current job descriptions, the skill set clusters into three buckets. The technical ones get you hired; the analytical and soft ones get you promoted.
Technical Skills: Protocols, Cloud, and Containers
You need fluency across the protocols your applications actually speak: HTTP/S and WebSockets for web, REST, GraphQL, and gRPC for APIs, and increasingly messaging protocols like MQTT and AMQP for IoT and event-driven systems. A tool that supports only HTTP leaves you blind the moment your architecture adopts gRPC for inter-service calls. Platform breadth matters here – WebLOAD covers 150+ protocols, which means one tool and one skill set carry you across a polyglot stack instead of forcing you to learn a new platform per protocol.
Infrastructure knowledge is no longer optional. You’ll provision load generators on AWS, Azure, or GCP, package them in containers, and orchestrate distributed generation across Kubernetes when a single machine can’t produce enough load. The rising demand for cloud performance engineers (a sub-niche trending up roughly 37% year over year) reflects exactly this shift toward cloud-native load generation.
Scripting & Programming: Why JavaScript Lowers the Barrier
Here’s where careers stall or accelerate. You need scripting – JavaScript for test logic, Python for data manipulation and analysis, shell scripting for automation glue. But which language your tool forces on you matters enormously.
JavaScript is the strategic choice because it’s a language your developers already write and your manual QA colleagues can learn without a context-switch into Scala, XML configs, or a proprietary DSL. When a tool uses standards-based JavaScript scripting – as WebLOAD does – a test script is just code your whole team can read, version in Git, and reuse. That single decision reduces the scripting fear that blocks so many manual testers from making the jump.
Analytical & Soft Skills: Reading the Numbers and Telling the Story
The hardest skill isn’t running a test – it’s interpreting one. Can you distinguish a memory leak from CPU saturation by watching heap growth climb steadily across a 2-hour soak test while CPU stays flat? Can you read a p99-vs-throughput curve and spot the knee point where the system stops scaling linearly?
This analytical rigor has a recognized backbone. Brendan Gregg’s USE Method – check Utilization, Saturation, and Errors for every resource – gives you a repeatable lens for turning raw metrics into root cause [3]. The competency framework behind the formal ISTQB Performance Testing certification formalizes these same analytical expectations [2]. And industry practitioners like Scott Moore and Jay Akselrud have flagged Continuous Testing fluency and these “missing skill sets” – shift-left thinking, cloud-native generation, and the ability to reason about results in a pipeline – as the differentiators that actually get people hired in 2025 [4].
The soft layer wraps it all: stakeholder communication, the ability to turn “p99 degraded 3x at 2,800 users” into a budget decision a non-technical director will fund.
The Bottleneck Detection Playbook: From Symptom to Root Cause
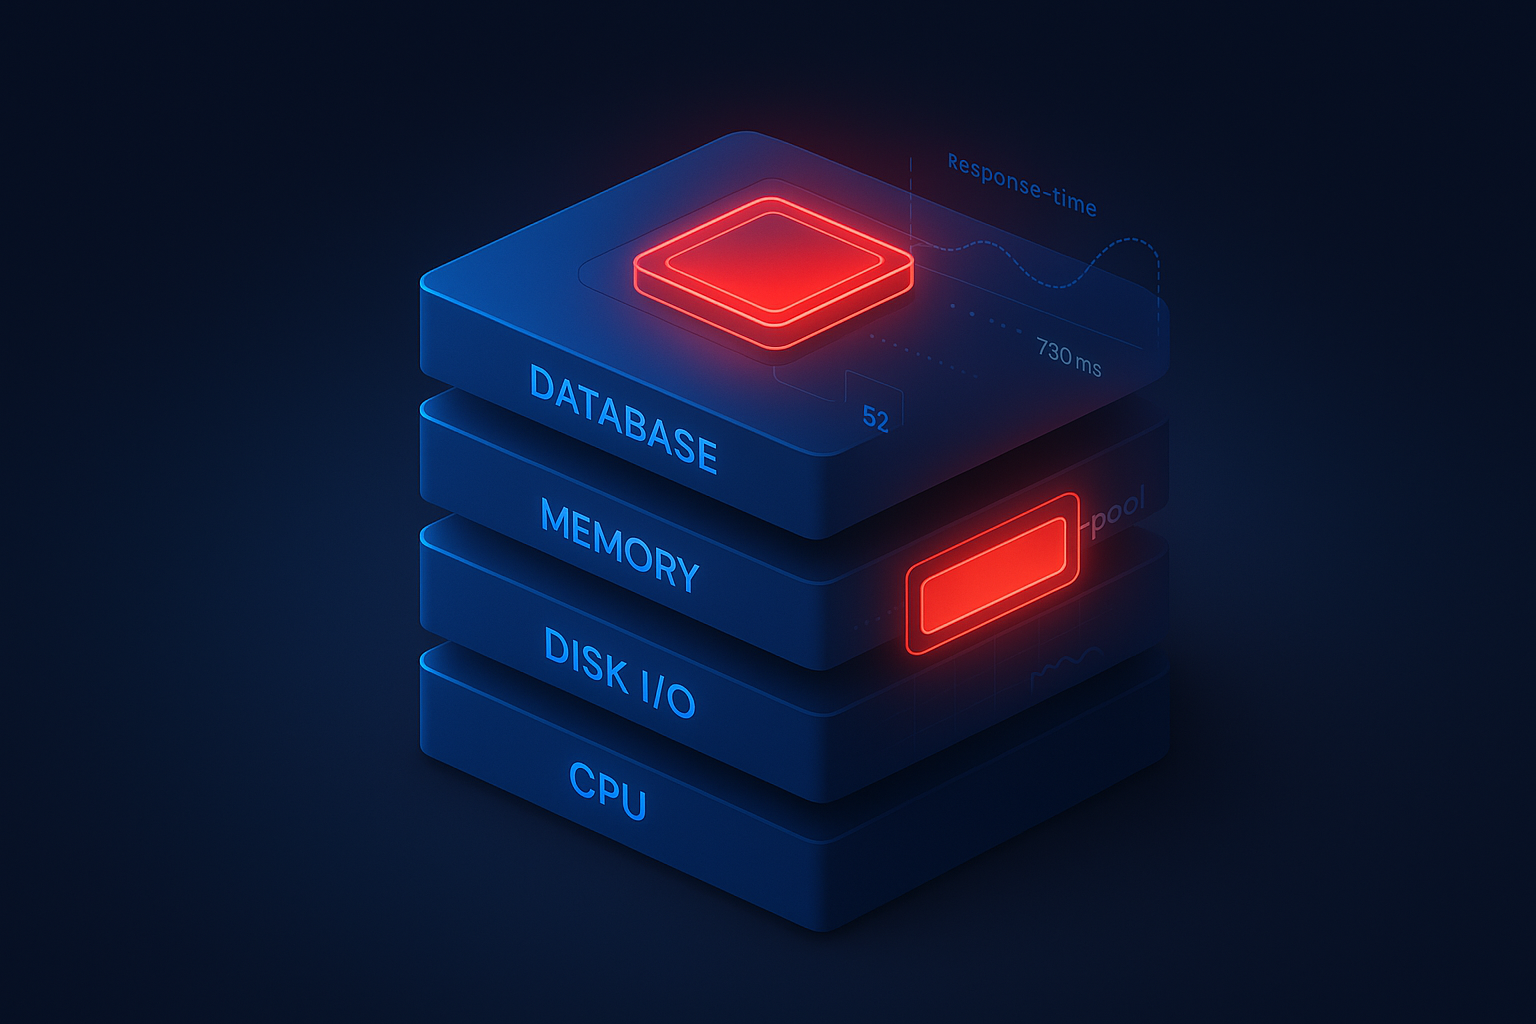
This is the part competitors gesture at and never deliver. Most articles list bottleneck types; almost none give you a repeatable path from a symptom to a confirmed cause. Here’s that path.
Step 1: Establish a Baseline Before You Diagnose
You can’t identify a regression without knowing what “normal” looks like. Before any diagnostic work, capture a documented baseline – for example: p95 = 180ms, throughput = 1,200 req/s, error rate < 0.1% at 1,000 virtual users. Gregg’s guidance is explicit that the USE Method is “intended to be used early in a performance investigation, to identify systemic bottlenecks” [3]; a baseline is what makes the early signals legible. Without it, every spike looks alarming and nothing looks actionable.
Layer-by-Layer: Symptom → Metric → Confirming Tool
Apply USE to each resource layer. For every one, ask: what’s the utilization, where’s the saturation, and are there errors?
| Layer | Symptom | Metric to Watch | Confirming Tool/Command |
|---|---|---|---|
| CPU | Latency climbs, CPU pegged | CPU utilization > 80%, run-queue length | top, mpstat, APM CPU graph |
| Memory | Latency grows over time, then OOM | Heap growth, GC pause frequency | vmstat, profiler (heap dump) |
| Disk I/O | Slow data retrieval under load | I/O wait > 20%, queue depth | iostat -x, iotop |
| Network | Throughput plateaus, retransmits | Bandwidth saturation, TCP retransmits | sar -n DEV, ss, packet capture |
| Database | App fast, DB slow | Slow query time, lock waits, pool exhaustion at max-pool size | Slow-query log, DB profiler |
The single biggest accelerator at this stage is correlation. A platform that overlays your load-test response-time curve against these system signals – as WebLOAD’s analytics do – lets you confirm in seconds whether a latency spike tracks with CPU saturation or database lock contention, rather than tabbing between five dashboards.
The Decision Tree: Walking a Symptom to Its Root Cause
Take the most common symptom – high latency under load – and route it:
- Is CPU utilization > 70%? → If yes, you likely have a CPU bottleneck (saturation). Profile the hottest code path. → If no, continue.
- Is database query time rising in step with latency? → If yes, check for connection-pool exhaustion (is active connections == max-pool size?) or slow queries (check the slow-query log). → If no, continue.
- Is I/O wait > 20% or network bandwidth saturated? → If yes, you’ve found a disk or network bottleneck. → If no, continue.
- Is heap growing steadily with rising GC pauses? → If yes, suspect a memory leak; capture a heap dump. → If no, look at thread/connection pools and third-party API latency.
Each node is a measurable USE signal – utilization, saturation, or errors – which is exactly why Gregg notes the method “solves about 80% of server issues with 5% of the effort” [3]. You’re not guessing; you’re eliminating.
Choosing Load Testing Tools Without Getting Locked In
The “load testing tools” category sits at high commercial intent and is flooded with affiliate listicles. Cut through it with criteria, not brand loyalty.
The Hidden Cost of Proprietary Scripting Languages
Some legacy enterprise suites require you to script in a proprietary language or a vendor-specific DSL. The cost isn’t the license fee – it’s everything downstream. Your script library becomes non-portable: switch tools and you rewrite hundreds of scripts from scratch. The hiring pool shrinks to people who already know that one language. And your team’s knowledge can’t transfer in or out.
Contrast a proprietary-DSL approach with standards-based JavaScript. A JavaScript test is readable by any developer, lives in Git like any other code, and survives a tool migration far better. That portability is the whole argument: your test assets stay yours, not the vendor’s. Standards-based JavaScript scripting (the approach WebLOAD takes) means the skill your team builds is a general-purpose, market-portable skill – not a dead-end specialty.
The Tool-Selection Criteria & Portability Checklist
Evaluate any tool against these five criteria:
| Criterion | What to ask | WebLOAD (worked example) |
|---|---|---|
| Scripting language openness | Standards-based or proprietary DSL? | Standards-based JavaScript |
| Script portability | Can scripts version in Git / survive migration? | Plain JS, Git-friendly |
| Protocol breadth | Does it cover REST, gRPC, WebSocket, messaging? | 150+ protocols |
| Deployment flexibility | Cloud, on-prem, or both? | Cloud and on-prem |
| CI/CD integration | Native pipeline hooks and CLI? | CI/CD and APM integration |
Score each tool you’re considering against all five before you sign anything. A high score on protocol breadth means nothing if the scripting is locked and the deployment is cloud-only when your compliance requires on-prem. For a deeper framework, see our guide on how to choose a performance testing tool.
APM & Observability Integration
A load test that reports only client-side response times tells you what broke, never why. The non-negotiable is correlating at least three metric types: response time (client-side), resource utilization (server-side: CPU, memory, I/O), and error rate. Integration with an APM or observability platform lets you line up your test’s p99 spike against the exact moment a database connection pool saturated – turning the USE-method signals from the playbook above into a single, confirmable timeline.
Writing Your First JavaScript Load Test
Enough theory. Here’s a runnable starter you can adapt today. The structure – setup, action, assertions – is consistent across JavaScript-based tools, including WebLOAD, so the pattern transfers regardless of which standards-based platform you land on.
// A basic JavaScript load test for a checkout API
export const options = {
  vus: 500,          // ramp to 500 virtual users
  duration: '5m',    // sustain for 5 minutes
  thresholds: {
    // Performance gates: the test FAILS if these are breached
    http_req_duration: ['p(95)<250'],  // p95 latency under 250ms
    http_req_failed:   ['rate<0.01'],  // error rate under 1%
  },
};

export default function () {
  // 1. Hit the endpoint
  const res = http.post('https://api.example.com/checkout', JSON.stringify({
    cartId: '12345',
    paymentToken: '__PARAM_TOKEN__',  // parameterized per VU
  }), { headers: { 'Content-Type': 'application/json' } });

  // 2. Assert the response is correct, not just fast
  check(res, {
    'status is 200': (r) => r.status === 200,
    'order confirmed': (r) => r.json('status') === 'confirmed',
  });

  sleep(1);  // think-time between iterations
}
Walking the blocks: options defines your load profile and your pass/fail thresholds – the p(95)<250 and rate<0.01 lines are your performance gates, the same ones you’ll enforce in CI/CD next. The default function is one virtual user’s behavior loop. The check() block asserts correctness under load, because a fast 500-error response is still a failure. Because this is plain JavaScript, a developer or a transitioning manual tester can read it, modify the payload, and run it without learning a new language.
Integrating Performance Testing into CI/CD
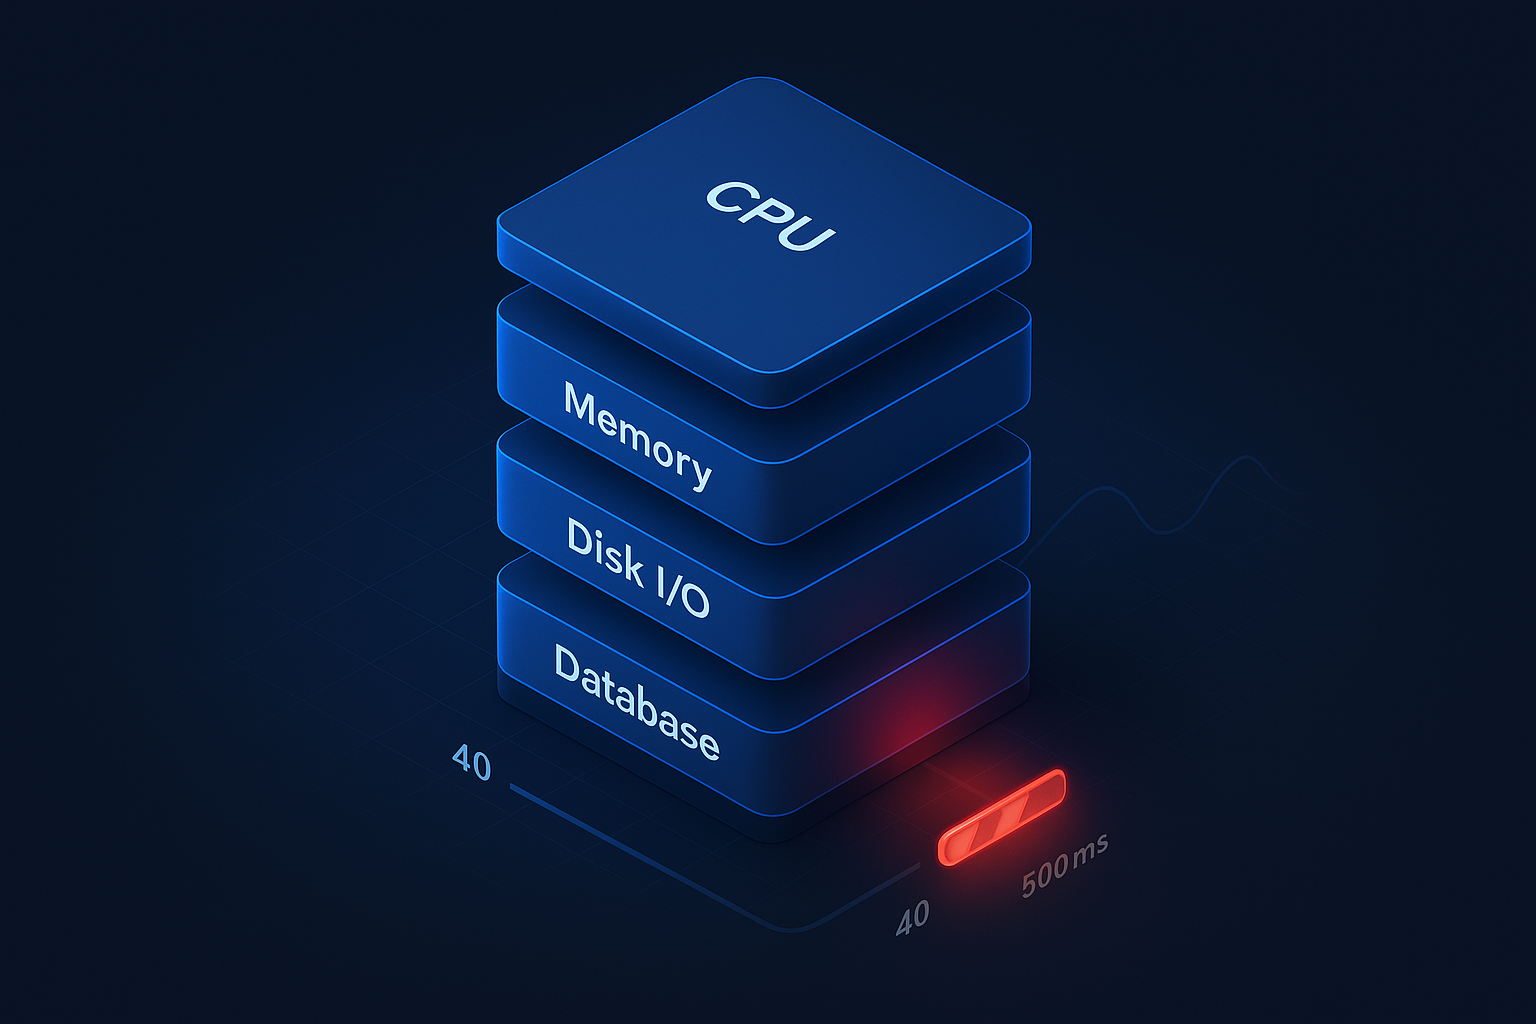
A load test you run by hand twice a quarter catches nothing. The value is in continuous, automated execution with gates that fail the build before a regression reaches production.
Where in the Pipeline Should Load Tests Run?
Don’t run the same test everywhere – match the test type to the pipeline stage:
- Per-commit: a lightweight smoke test, ~50 VUs for 2 minutes. Catches gross regressions in seconds without slowing the pipeline.
- Nightly: a fuller soak test, ~2,000 VUs for 1 hour. Surfaces memory leaks and slow degradation that short tests miss.
- Pre-release: the full-scale test at production-equivalent load, validating the SLA before you ship.
Tie each gate’s threshold to your SLO budget. Google’s SRE guidance on Service Level Objectives makes the case that a service consuming its error budget should slow down its release pace [1] – the same logic applies here. If a nightly soak burns through your latency budget, the pipeline should know.
Setting Performance Gates That Fail the Build
Here’s a GitHub Actions snippet that runs the test and fails the build on a threshold breach:
name: Performance Gate
on: [pull_request]
jobs:
  load-test:
    runs-on: ubuntu-latest
    steps:
      - uses: actions/checkout@v4
      - name: Run load test (containerized generator)
        run: |
          docker run --rm -v $PWD:/tests loadtest-image \
            run /tests/checkout-test.js
        # The runner exits non-zero when a threshold
        # (p95 < 250ms, error rate < 1%) is breached,
        # which automatically fails this job and blocks the merge.
The mechanism is simple: your test defines the thresholds (p95 < 250ms, error rate < 1% from the script above), the runner exits non-zero when they’re breached, and the failed job blocks the merge. Containerized load generation keeps the run reproducible across machines, and piping results into your APM closes the loop so a failing gate links straight to the resource graph that explains it.
Career Path: From Manual QA to Senior Performance Engineer

Now the career-as-craft spine. Here’s the ladder, with real numbers and a transition map.
The Salary-Banded Progression Ladder
| Level | Focus | Compensation (with source) |
|---|---|---|
| Junior Load Tester | Running scripts, basic analysis | ~$17 – $47/hr (ZipRecruiter, Jun 2026) [5] |
| Load Tester / Perf Test Engineer | Scripting, correlation, NFR validation | QA analyst/tester median $102,610/yr (BLS, May 2024) [6] |
| Performance Engineer | Architecture, capacity planning | Above median; BLS top 10% > $166,960 [6] |
| Principal Perf Engineer / SRE | System design, reliability ownership | Senior bands, varies by region/industry |
The macro picture is favorable: the U.S. Bureau of Labor Statistics projects employment for software developers, QA analysts, and testers to grow 15% from 2024 to 2034 – much faster than average – with about 129,200 annual openings [6]. Demand isn’t the constraint; skills are.
Transitioning from Manual QA: Your Skills Already Transfer
The biggest myth blocking manual testers is that they’re starting from zero. You’re not. Your existing competencies map almost directly:
| Manual QA Skill | Performance Testing Equivalent |
|---|---|
| Test case design | Workload modeling (designing realistic load profiles) |
| Defect reporting | Bottleneck analysis and root-cause reporting |
| Exploratory testing | Hypothesis-driven performance investigation |
| Regression suites | Automated CI/CD performance gates |
The one genuinely new skill is scripting – and that’s exactly why a JavaScript-based tool like WebLOAD lowers the barrier. You’re learning a mainstream language, not a vendor’s proprietary dialect, so the effort compounds across your career. Plenty of testers have made this jump in a quarter: the ones who succeed pick one tool, script one real scenario end-to-end, and produce one report they can show in an interview.
Your 90-Day Learning Roadmap
A dated, numbered path (current as of 2025 – revisit annually as Continuous Testing practices evolve):
- Days 1 – 15 – Foundations: percentile metrics (p50/p95/p99), throughput, the difference between load, stress, and soak tests.
- Days 16 – 40 – JavaScript scripting: write and run the starter script above; learn correlation and parameterization.
- Days 41 – 60 – Tool mastery: pick one platform, master distributed/cloud load generation and reporting.
- Days 61 – 75 – CI/CD integration: add a performance gate to a pipeline that fails on a threshold breach.
- Days 76 – 90 – APM & portfolio: correlate a test with system metrics, then produce a sample load-test report (with p95/p99 and a root-cause finding) as your interview portfolio piece.
That final deliverable matters most – it’s the proof of Experience that thin résumés lack. Scott Moore and Jay Akselrud’s emphasis on Continuous Testing fluency [4] is precisely what stages 4 and 5 build.
Certifications & Closing the Training Gap
Certifications won’t replace a portfolio, but they signal a baseline and structure your learning.
The Sequenced Certification Roadmap
Sequence credentials by stage rather than collecting them randomly:
- Foundation – ISTQB CTFL (Certified Tester Foundation Level): the prerequisite for the specialist track.
- Specialist – ISTQB CT-PT (Certified Tester Performance Testing): the official page states it’s “aimed at anyone… who wishes to start a specialist career in performance testing,” requires CTFL first, and uses a 40-question exam with a passing score of 26 over 90 minutes [2].
- Observability – APM/Full-Stack Observability credentials: validate the correlation skills the bottleneck playbook demands.
The strategic point competitors miss: CT-PT requires CTFL, so plan the sequence rather than discovering the prerequisite mid-registration.
Building a Budget-Tiered Team Training Plan
For managers facing a team skills gap, the cost of not training is concrete: untrained teams ship poor application performance, which drives user dissatisfaction, failed launches, and expensive rework – latency directly erodes conversion. A tiered remediation plan:
- Free tier: self-study with public docs, the USE Method, and hands-on practice writing JavaScript tests against a staging environment.
- Certification tier: fund CTFL → CT-PT for one or two team members to establish an internal competency anchor.
- Enterprise tier: structured instructor-led courses from specialist training providers plus tool-specific enablement to build a performance testing center of excellence.
The ROI argument writes itself: one prevented launch-day outage typically dwarfs an entire year’s training budget.
Hiring a Load Tester: A Quick Checklist for Managers
For DevOps managers and IT architects screening candidates – a fast filter.
Must-have skills checklist:
- Protocol fluency (HTTP/S, REST, plus at least one of gRPC/GraphQL/WebSocket)
- Scripting in a mainstream language (JavaScript or Python)
- Percentile-based analysis (can explain p95 vs. p99)
- CI/CD and APM integration experience
- Bottleneck root-cause reasoning (maps to the ISTQB CT-PT competency framework [2])
One interview question worth asking: “Walk me through how you’d diagnose a latency spike that appears only above 2,000 concurrent users.” Strong candidates reach for a baseline, then a USE-style elimination across layers – not a guess.
Take-home assignment: ask the candidate to script and run a load test against a sample API and produce a one-page report with p95/p99 latency, error-rate analysis, and a root-cause hypothesis. It reveals scripting ability, analytical rigor, and communication in a single exercise.
One hiring tip: tools built on standards-based JavaScript – like WebLOAD – widen your candidate pool, because you’re not restricted to the scarce few who know a proprietary language.
So where does this leave you? You can now tell a load tester from a performance engineer from an SRE, map a salary-banded path from manual QA to senior, write and run a JavaScript load test, walk a latency spike to its root cause with a decision tree, and gate a CI/CD pipeline on real performance thresholds. That’s not a definition of the role – that’s the practice of it.
The learning curve is real, and no tool makes performance engineering fully hands-off; a human still has to read the curve and make the call. But standards-based, JavaScript-friendly tooling genuinely shortens the path from “I run manual test cases” to “I own performance at scale, cloud or on-prem.” Pick one scenario this week, script it, gate it, and produce a report you’d show in an interview. Then bookmark this guide – we’ll keep it current as the practices shift, and you’ll want it again at your next role-progression milestone.
Disclaimer: Salary figures cited here are drawn from the referenced aggregators and U.S. government data as of their stated dates and vary by region, seniority, and industry. WebLOAD by RadView is the publisher’s product; all tool comparisons in this guide are made against criteria-based, vendor-neutral evaluation factors rather than promotional claims.
References
- Google. (N.D.). Service Level Objectives. Site Reliability Engineering (The SRE Book). Retrieved from https://sre.google/sre-book/service-level-objectives/
- International Software Testing Qualifications Board (ISTQB). (N.D.). Certified Tester Specialist Performance Testing (CT-PT). ISTQB. Retrieved from https://www.istqb.org/certifications/specialist/performance-testing/
- Gregg, B. (2012). The USE Method. brendangregg.com (also published as “Thinking Methodically about Performance,” ACM Queue, 2012; Communications of the ACM, 2013). Retrieved from https://www.brendangregg.com/usemethod.html
- Moore, S., & Akselrud, J. (2025). Continuous Testing and the Missing Skill Sets in Performance Testing [industry discussion]. Referenced for 2025 Continuous Testing skill-set trends.
- ZipRecruiter. (2026). Load Tester Jobs – Salary Data. ZipRecruiter. Retrieved from https://www.ziprecruiter.com/Jobs/Load-Tester
- U.S. Bureau of Labor Statistics. (2025, August 28). Software Developers, Quality Assurance Analysts, and Testers. Occupational Outlook Handbook, U.S. Department of Labor. Retrieved from https://www.bls.gov/ooh/computer-and-information-technology/software-quality-assurance-analysts-and-testers.htm