
Introduction
In a world of rapid development, Continuous Integration/Continuous Delivery (CI/CD) revolutionized the building and delivering of software applications.
Most of the time, though, application performance is an afterthought in such pipelines, leaving teams exposed to critical bottlenecks once the applications go live.
Integrating performance testing into your CI/CD process enables you to catch problems early, ensure scalability, and gain confidence in each release. This guide covers best practices, actionable examples, and tools to get you started.
Why Integrate Performance Testing into CI/CD?
Omitting performance testing in your CI/CD pipeline often leads to failures post-deployment, costly remediation, and poor user experiences.
Recent findings bring out its importance:
💡 Gartner Insight
⚠️ “Applications with performance issues lead to loss of revenue and brand damage, especially during peak usage times.”
🛠️ Shift-Left Advantage
✅ Integrating performance testing earlier in CI/CD pipelines can reduce production issues by up to 30%, according to industry insights.
📉 User Abandonment Statistics
⏱️ Applications that fail to meet performance benchmarks face a staggering 53% abandonment rate after just a few seconds of delay.
Integrating performance testing provides:
- Early detection of bottlenecks.
- Realistic performance baselines across the pipeline
- Streamlined testing processes without slowing releases
Best Practices to Seamlessly Integrate Performance Testing into CI/CD
- Automate Performance Tests in Build Pipelines: Include performance scripts to automatically run as part of your CI/CD process. The scripts should invoke load testing tools at the end of a build or pre-deployment steps.
Illustrative Instruments for Automation: Jenkins Pipelines: Trigger automated load tests during builds.
– Azure DevOps easily incorporates performance testing tasks.
– WebLOAD: Provides automation hooks for CI/CD pipelines
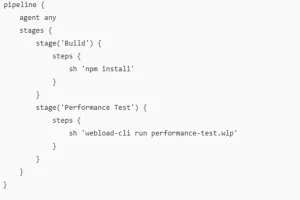
Here, WebLOAD scripts are run directly in Jenkins so that performance verification is executed for every build.
2.Define Performance SLAs and Pass/Fail Thresholds: Define practical performance metrics, such as SLAs, for key user journeys including response time, throughput, and error rate. Use these SLAs to determine whether a build is successful or not.
Examples SLAs:
– API Response Time: < 2 seconds.
– Concurrent Users: Up to 5,000 with 0.1% error rate.
In WebLOAD, you can set thresholds and validate against SLAs as part of automated test results. Similarly, open-source tools like JMeter allow assertions for response times and success rates.
3. Run Tests in Parallel for Faster Insights: Parallel execution of performance tests ensures that results are available quickly without delaying the pipeline. Use distributed load generators to scale your testing across environments.
Example:
Utilize Docker-based load generators, spinning up multiple containers at a time for load testing.
Tools like WebLOAD allow you to generate distributed load across regions, so you can get faster and more scalable testing.
4. Simulate Realistic Workloads
Performance tests must simulate realistic traffic, user behaviors, and asynchronous protocols to be effective.
Include:
- Mixed HTTP and WebSocket traffic for real-time apps.
- Think time to mimic actual user pauses.
- Dynamic session handling to correlate live values like session IDs.
Example (WebSocket Test with WebLOAD):
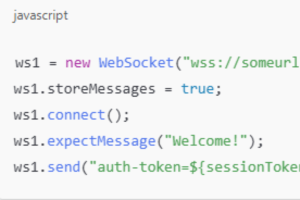
By scripting such scenarios, you can test real-world user flows and ensure your app performs under load.
5. Monitor and Visualize Results:
Integrate real-time monitoring tools to analyze results and spot regressions. Use dashboards to visualize key metrics like response times, resource utilization, and error rates.
- Example Tools for Visualization:
- Grafana: Connects to testing tools for real-time metrics.
- Built-in Dashboards: Tools like WebLOAD provide trend analysis and actionable insights across test runs.
✅ Best Practice: Track performance trends over multiple builds to identify regressions early.
Example: Performance Testing Pipeline for E-Commerce
Scenario:
An online retailer integrates performance testing into their CI/CD pipeline to ensure the application handles 10,000 concurrent users during holiday peaks.
Steps:
- A developer commits new changes.
- The pipeline triggers:
- Unit tests → Integration tests → WebLOAD load tests.
- WebLOAD runs a scenario:
- Users login → Browse products → Add to cart → Checkout.
- Results are visualized in a dashboard, validating SLAs for:
- Checkout time < 2 seconds.
- Error rate < 0.1%.
✅ Outcome: Bottlenecks in the checkout API were identified early, leading to optimizations that reduced latency by 30%.
Benefits of Integrating Performance Testing into CI/CD
- Improved Efficiency: Automate testing, saving time and manual effort.
- Higher Confidence: Every build meets performance standards.
- Reduced Costs: Detect and fix issues early when they are cheaper to resolve.
- Scalable Testing: Use distributed testing tools to validate peak loads effortlessly.
Related: Guide to Continuous Performance Testing
Integrating performance testing into CI/CD pipelines ensures that applications are ready for real-world usage without sacrificing release speed. By automating load tests, simulating real workloads, and visualizing results, teams can build confidence and deliver exceptional user experiences.
Tools like WebLOAD and CI/CD platforms (e.g., Jenkins, Azure DevOps) make this process seamless and scalable for enterprise needs.
If you’re looking for a tool that supports realistic load testing scenarios with robust automation and reporting capabilities, explore WebLOAD’s CI Performance Testing Solution to take your performance testing strategy to the next level. Get Your Free Trial of WebLOAD.


