You’ve got fourteen browser tabs open. One’s a vendor demo, three are “Top 20 Tools” lists that all rank the same products in different orders, and you still can’t answer the question your VP asked in standup: do we need a load testing tool, an APM platform, or both? Worse, every article you read either explains what a percentile is (you know) or drops a comparison table with zero guidance on how to actually decide.
Here’s the gap nobody fills: the search results treat pre-production load testing and production monitoring as two separate universes. They aren’t. They’re two halves of one performance discipline, and the teams that ship reliably treat them as a single feedback loop. Demand for clarity here is climbing – interest in “application performance testing tools” is up 34% year over year, and the SERPs haven’t caught up.
So this guide does something different. You’ll get a working taxonomy that connects testing to monitoring, a weighted and role-aware selection scorecard that kills analysis paralysis, copy-paste CI/CD recipes with percentile gates, a symptom-to-root-cause diagnostic playbook, and a full-stack observability reference architecture. One caveat up front: nothing here promises self-driving testing. AI accelerates scripting and anomaly detection, but a human still owns the decision to block a release. Let’s get into it.
- The Application Performance Tools Landscape: Testing vs. Monitoring vs. Profiling
- Load and Performance Testing Tools: Protocols, Browsers, and APIs Under Pressure
- APM vs. Load Testing: The Distinction Engineers Keep Getting Wrong
- Diagnosing Slowness Under Load: A Symptom-to-Root-Cause Playbook
- The Engineer’s Tool Selection Framework: A Weighted, Role-Aware Scorecard
- Integrating Load Testing into CI/CD: Copy-Paste Recipes and Percentile Quality Gates
- Full-Stack Visibility: Unifying APM, RUM, and Observability with OpenTelemetry
- Frequently Asked Questions
- What is the difference between APM and load testing tools?
- Do I need multiple performance tools or one integrated platform, and can load testing replace APM?
- How do I choose between open-source and commercial tools, and what should I use in CI/CD?
- Is it worth gating every pull request on a full load test?
- How do I make sure my staging test results actually reflect production?
- References
The Application Performance Tools Landscape: Testing vs. Monitoring vs. Profiling

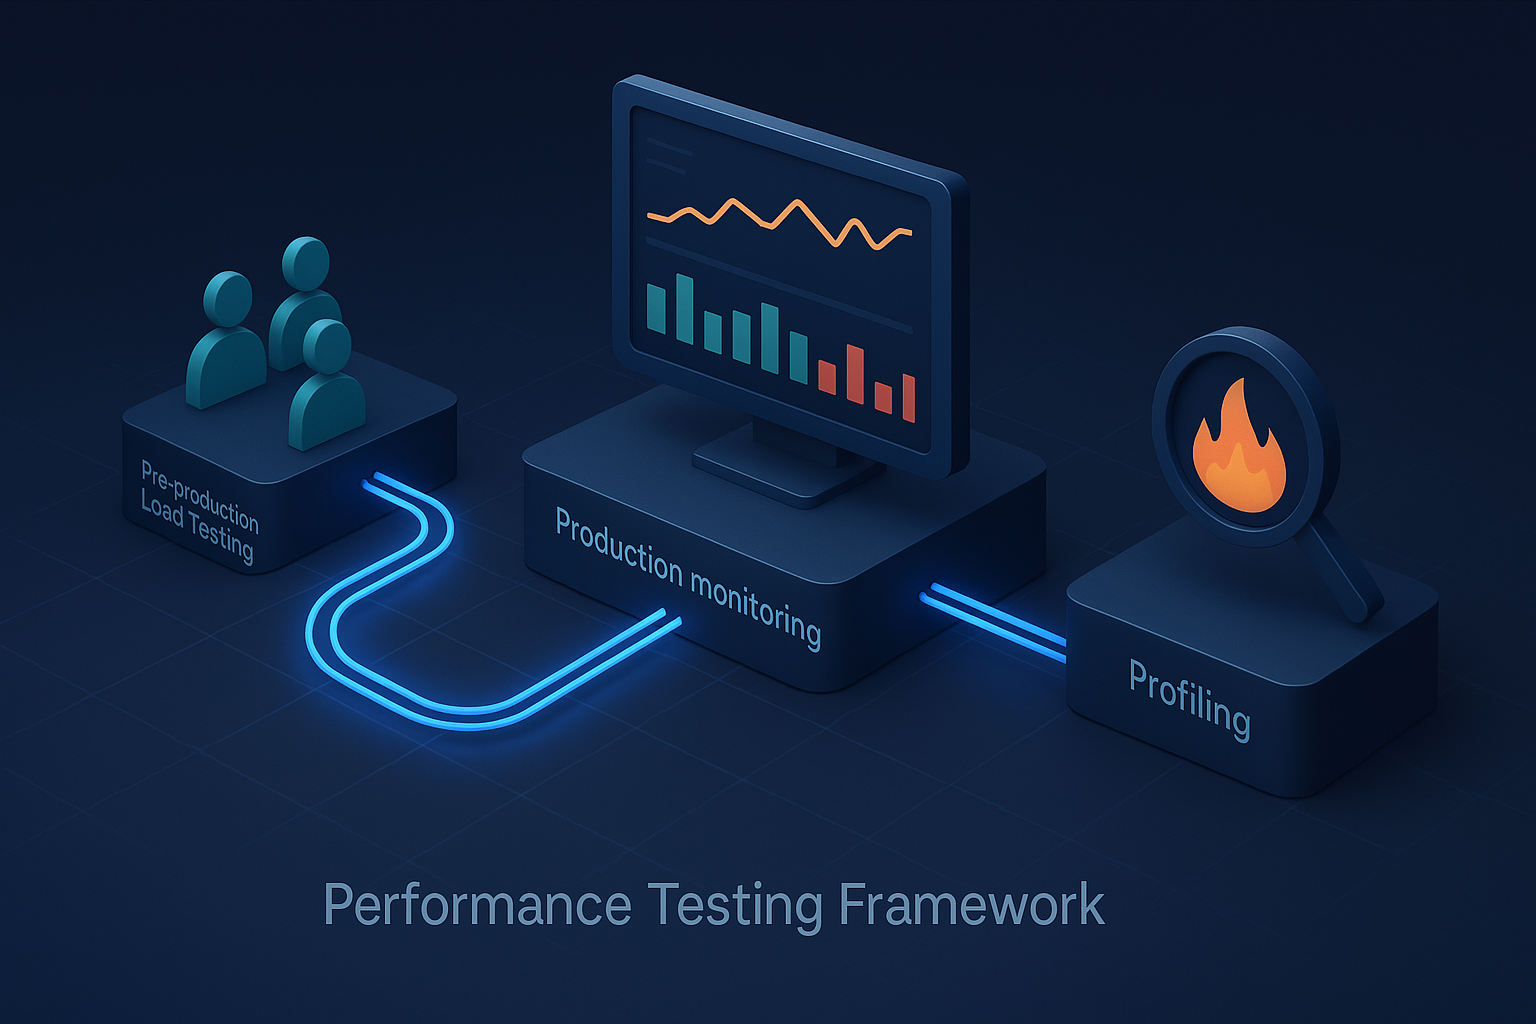
The single biggest source of tool confusion is conflating three distinct activities that happen at three different points in the lifecycle. Pre-production load testing answers “will it hold up?” before users arrive. Continuous monitoring – APM, RUM, synthetic monitoring – answers “is it holding up right now?” Profiling answers “exactly which line of code, query, or resource is the culprit?” Most ranking articles cover one and ignore the rest.
A vendor-neutral anchor helps here. OpenTelemetry, a Cloud Native Computing Foundation project, defines itself as “an observability framework and toolkit designed to facilitate the Generation, Export, and Collection of telemetry data such as traces, metrics, and logs,” and is explicit that it is “not an observability backend itself” [1]. That distinction – instrumentation standard versus the platform that stores and visualizes the data – maps directly onto the broader landscape: tools either generate signal, collect it, or interpret it. The analyst methodology behind the APM and observability evaluation space (the framework large enterprises lean on for vendor positioning) similarly separates these capability clusters rather than lumping them into one “performance” bucket [2]. For more on the standard itself, see the CNCF OpenTelemetry project overview.
Here’s a capability matrix to ground the rest of this guide:
| Category | Primary Environment | Data Type | Primary User |
|---|---|---|---|
| Load/performance testing | Staging / pre-prod | Synthetic (scripted virtual users) | Performance engineer, QA lead |
| APM | Production | Real traffic + traces | SRE, backend dev |
| RUM | Production | Real user (browser/device) | Front-end dev, product |
| Synthetic monitoring | Production (scheduled) | Synthetic (scripted checks) | SRE, ops |
| Profilers / observability | All phases | Resource + telemetry | SRE, performance engineer |
On total cost of ownership: a single line item – cloud load generation – runs roughly $20 – $60 per 1,000 virtual-user-hours depending on region and instance type, and that’s before you add the 20 – 40 engineering hours a new team typically spends learning a scripting model. The sticker price is the smallest number in the equation.
A Working Taxonomy: Performance Testing, Monitoring, and Profiling Defined
Think of it like opening a Broadway show. Load testing is the dress rehearsal under full stage conditions – you find out the trapdoor sticks before a paying audience watches the lead fall through it. Monitoring is the security cameras running every night the show is live. Profiling is the autopsy when a scene fails: you replay the footage frame by frame to find the exact missed cue.
The Google SRE team frames the underlying purpose precisely: your monitoring “should address two questions: what’s broken, and why? The ‘what’s broken’ indicates the symptom; the ‘why’ indicates a (possibly intermediate) cause” [3]. Testing and monitoring answer different halves of that. Practical triggers: run load tests before a Black Friday traffic spike; keep APM and RUM always-on in production; reach for a profiler when p99 latency crosses 500ms and you need the offending method. For the foundational treatment, see Google SRE guidance on monitoring distributed systems.
Tool Categories and When to Use Each Across the SDLC
Decision rules beat definitions. Use these:
- If you’re in development and need fast feedback on a single service → run a smoke load test (200 VUs) plus a CPU profiler locally.
- If you’re in staging and need to validate capacity before release → run a full load/soak test against production-mirrored data.
- If you’re in production and need to know real user experience → deploy RUM.
- If you’re in production and need always-on backend transaction tracing → deploy APM.
- If you need to catch regional outages before users report them → deploy synthetic monitoring from multiple geographies.
- If you need to correlate signals across all of the above → standardize on observability instrumentation.
The CNCF observability landscape codifies these categories as distinct-but-interoperable, which is why the official OpenTelemetry documentation treats one instrumentation layer as feeding many backends rather than locking you into a single tool.
Total Cost of Ownership: Beyond the Sticker Price
Cost-per-VU is the unit that lets you compare apples to apples, and it has to include everything. Here’s a worked comparison over a year, assuming a team that needs ~5,000 concurrent VUs in periodic test runs:
| Cost line | Open-source self-hosted | Commercial / SaaS |
|---|---|---|
| License | $0 | ~$15,000 – $40,000 |
| Infrastructure (load generators) | ~$8,000 (self-managed cloud VMs) | Often bundled |
| Training / ramp | ~120 eng-hours (~$12,000) | ~40 eng-hours (~$4,000) |
| Integration / maintenance | ~150 eng-hours/yr (~$15,000) | ~40 eng-hours/yr (~$4,000) |
The open-source path looks free until the ~270 engineer-hours of build-and-maintain land on a senior salary. That’s the trade-off the alphabetical lists never quantify – and it’s why “free” tools sometimes cost more than licensed ones at scale, a tension explored further in our comprehensive guide to open source testing tools. (Methodology note: these are illustrative figures at ~$100/eng-hour; your numbers will vary by region and team.)
Load and Performance Testing Tools: Protocols, Browsers, and APIs Under Pressure
This is the pillar most monitoring-focused roundups skip entirely. Pre-production load testing is where you discover the 4,000-user cliff while it’s still cheap to fix. The discipline breaks into testing types – load (expected traffic), stress (beyond expected, to find the breaking point), spike (sudden surge), soak/endurance (sustained load over hours to surface leaks), and scalability (does adding capacity actually help?). The recognized vendor-neutral reference for this terminology is the ISTQB Performance Testing certification syllabus.
Four evaluation criteria recur throughout this section and feed the framework later: scripting ease, reporting depth, CI/CD integration, and protocol support. On the last one – protocol breadth is the difference between one tool and three. A widely used open-source tool handles common HTTP scenarios well but leaves you reaching for adapters when you hit message queues or legacy middleware. RadView’s platform, by contrast, covers 150+ protocols out of the box, which is what lets a single tool drive a mixed enterprise stack – say, sustaining 50,000 concurrent virtual users from hybrid load generators across HTTP/2, WebSocket, gRPC, MQTT, AMQP, and SOAP simultaneously.
Protocol-Level Load Testing and Why Protocol Breadth Matters
Protocol-level virtual users replay traffic at the wire level – they parameterize captured sessions (session tokens, dynamic IDs) and replay them at scale without spinning up a browser per user, which is why a single generator can drive tens of thousands of VUs. The payoff of breadth is consolidation: if you’re testing a microservices app where service A speaks gRPC, the event bus speaks MQTT, and a legacy billing component still speaks SOAP, a tool that covers all three means one script repository, one reporting model, one license to manage – not three tools fighting for budget and attention. (Disclosure: protocol counts reflect documented platform capability; validate against your specific stack in a POC.)
Browser-Level Testing for SPAs and API Load Testing for Microservices
Protocol-level testing measures server response time. It does not measure what the user actually sees. For a single-page app, that gap is enormous: a protocol-level test might report a 1.2s response for the API call, while a browser-level test – which renders the page in a real browser engine – shows 3.8s to interactive, because client-side JavaScript spends 2.6s parsing, executing, and painting. If you only run protocol-level tests on a JS-heavy SPA, you’ll ship something that benchmarks fine and feels slow. Browser-level testing closes that gap; our deeper treatment lives in browser-level performance testing.
On the API side, REST, GraphQL, and gRPC each demand different load patterns. GraphQL especially: a single endpoint can hide wildly variable backend cost depending on query shape, so your test scenarios must mirror real query complexity, not just hammer one canonical request. See API load testing for endpoint-specific scripting patterns.
Cloud, On-Premises, and Hybrid Load Generation Strategies
Where your load generators live affects both realism and compliance. Cloud generators give you geographic distribution and elastic scale; on-prem generators give you control and keep regulated data inside your perimeter. Hybrid is the pragmatic enterprise default. A concrete decision rule: if data residency is regulated AND your traffic origin is global, then run on-prem controllers for orchestration plus cloud generators deployed in compliant regions – so you mirror real user geography without exporting sensitive payloads. (When citing any throughput figure, pin it to a config: e.g., 50,000 VUs from c5.4xlarge generators across three regions.)
APM vs. Load Testing: The Distinction Engineers Keep Getting Wrong
“Can’t APM just replace load testing?” No – and the reason matters. APM observes real traffic that has already arrived. Load testing manufactures traffic that hasn’t arrived yet. You cannot use APM to find out whether your Black Friday peak will hold, because by the time APM sees that peak, it’s Black Friday and the cliff is now a customer-facing outage. The two are complementary, and in the broader industry framing APM is best understood as one technique within a wider observability practice.
| Dimension | Load Testing | APM |
|---|---|---|
| When used | Pre-production, scheduled | Production, continuous |
| Environment | Staging / mirrored | Live |
| Data type | Synthetic virtual users | Real user transactions |
| Primary users | Performance engineers, QA | SREs, backend devs |
| Sample category | Protocol/browser load generators | Transaction-tracing agents |
A worked correlation makes the relationship concrete. In a recent test run, at 5,000 concurrent users p95 latency jumped from 600ms to 2.4s. The load tool flagged the symptom; exporting those metrics into the APM layer revealed the cause – a single N+1 database query in the cart-summary endpoint consuming 70% of transaction time. Neither tool alone closes the loop. Together they do. The instrumentation that bridges them is increasingly OpenTelemetry; see the official OpenTelemetry documentation.

Side-by-Side: What Each Tool Class Actually Measures
Read the table above row by row. “Data type” is the cell engineers most often gloss over: synthetic virtual users let you control the exact load profile and reproduce it on demand; real user transactions give you ground truth but only for traffic that actually happened. You need both kinds of data for different decisions – one for capacity planning, one for experience validation. Define each term once, then move on; the conflation happens when teams assume “real traffic” data can substitute for “controlled load” data.
Better Together: A Load-Test-to-APM Feedback Loop
The loop runs both directions. Forward: load test → APM trace → tune → re-baseline. Backward: APM production data → realistic load profile design. That second direction is the one teams forget. Your APM dashboard knows your real production traffic mix – say, 60% search, 25% checkout, 15% browse. Feed those exact ratios into your load test scenario so you’re stress-testing the workload users actually generate, not a uniform distribution that exercises endpoints nobody hits. Our broader treatment of monitoring’s role in experience lives at enhancing user experience with application monitoring.
Diagnosing Slowness Under Load: A Symptom-to-Root-Cause Playbook
Your app sails through 1,000 users but collapses at 4,000. Where do you look first? Most engineers go hunting for the slowest single query. That’s often the wrong instinct.
The Google SRE four golden signals give you the starting map: “latency, traffic, errors, and saturation. If you can only measure four metrics of your user-facing system, focus on these four” [3]. And the symptom/cause layering matters in a distributed system: “one person’s symptom is another person’s cause” – slow database reads are a symptom to the DB engineer but a cause to the front-end engineer [3]. Reference: Google SRE guidance on monitoring distributed systems.
| Layer | Symptom | Detection technique | Named metric |
|---|---|---|---|
| Database | p95 query time climbs with concurrency | Slow-query log + query profiler | p95 query time |
| Application code | CPU saturates before throughput target | Flame graph / method profiler | Method self-time |
| Network | Latency spikes with no CPU pressure | Packet capture / latency breakdown | TLS handshake ms |
| Infrastructure | Throughput plateaus, queues grow | Saturation metrics | CPU run-queue length |
The Counterintuitive First Rule: Aggregate Load Beats Isolated Latency
Here’s the principle that separates senior diagnosticians from junior ones: a fast query run constantly can crush you harder than a slow query run rarely. The math is brutal. A 5ms query executed 10,000 times per request totals 50 seconds of aggregate database work per request. A single 800ms query? 0.8 seconds. You’d chase the 800ms outlier for hours while the real killer is the innocent-looking 5ms query in a loop. Practitioner consensus on engineering forums has long held that throughput and aggregate frequency, not isolated latency, are where load-induced collapse usually originates [4]. Profile by total time consumed, not by single-call duration. For a structured approach to isolating these issues, see our guide on how to test and identify bottlenecks in performance testing.
Layer-by-Layer Detection: Database, Code, Network, Infrastructure
Brendan Gregg’s USE Method – check Utilization, Saturation, and Errors for every resource – gives you a systematic sweep so you don’t tunnel-vision on one tier. Walk it: database (slow-query log surfaces the offending statements, p95 query time quantifies degradation), application code (flame graphs expose hotspot methods by self-time), network (packet capture breaks latency into DNS, TLS handshake, time-to-first-byte), infrastructure (CPU run-queue length above core count signals you’re saturation-bound, not code-bound). Each layer has its metric; collect all four before you form a hypothesis.
Triggering Profiling During Peak Load and Ensuring Test-Environment Fidelity
The trick is capturing profiler data at the moment of peak, not after recovery. Wire your CPU/memory/DB profilers to trigger automatically when the load test crosses a saturation threshold, so heap dumps and flame graphs capture the system in distress. This is especially critical for endurance/soak tests where memory leaks only manifest after hours – see endurance testing in software guide.
One honest caveat that bites teams constantly: fidelity. Staging at 25% of production data volume can completely hide index-degradation bottlenecks that only appear past 10 million rows. If your staging database is a fraction of production size, your clean test results are lying to you. Disclose and account for these deltas before you trust a green run.
The Engineer’s Tool Selection Framework: A Weighted, Role-Aware Scorecard
This is the part the checklists get wrong. A flat “12-point checklist” treats every criterion as equal and every team as identical. Neither is true. A defensible framework does two things: it eliminates fast on hard requirements, then it scores the survivors with weights tuned to your role and infrastructure. Both the structured analyst evaluation methodology [2] and the vendor-neutral ISTQB Performance Testing certification syllabus support weighted, criteria-based assessment over generic comparison.
A baseline weighted rubric (tune these to your context):
- Protocol coverage – 25%
- Scripting effort – 20%
- CI/CD hooks – 20%
- Scalability ceiling – 20%
- Cost-per-VU – 15%
And a hard disqualifier with a real threshold: eliminate any tool that cannot sustain 20,000 VUs from a single hybrid generator if your roadmap requires that scale. Don’t score it. Cut it.
Eliminate Fast: A Disqualification-First Funnel
Reframe the problem from “compare everything” to “eliminate non-fits.” Run every candidate through binary hard requirements first – these are pass/fail, no scoring:
- Supports your required protocols (e.g., gRPC + MQTT)? No → cut.
- Sustains your peak VU target (e.g., ≥20,000)? No → cut.
- Meets compliance/data-residency constraints? No → cut.
- Supports your deployment model (hybrid)? No → cut.
- Has CI/CD integration (CLI or REST API)? No → cut.

In practice, this funnel takes a list of 15 tools down to 3 – 4 in an afternoon. One team we worked with eliminated 11 of 14 candidates on the protocol and VU-ceiling gates alone, turning a multi-week comparison into a one-week shortlist. That’s the antidote to tool overload.
Weighting by Role: QA Lead vs. SRE vs. DevOps Manager
The same criteria get re-weighted by who’s deciding:
- QA lead: scripting effort 30%, reporting 25%, protocol coverage 20%, CI/CD 15%, cost 10%.
- SRE: observability integration 30%, scalability ceiling 25%, CI/CD 20%, protocol coverage 15%, cost 10%.
- DevOps manager: CI/CD hooks 30%, cost-per-VU 25%, scalability 20%, scripting 15%, support SLA 10%.
Notice the SRE weights observability integration far higher than the QA lead does – because the SRE will live with how this data correlates against production telemetry. Disclose your weighting rationale so the decision is auditable. See our deeper template on how to choose a performance testing tool for the full walkthrough.
Running a Reproducible Proof-of-Concept (POC)
Run the identical scenario across every shortlisted tool and measure objectively. A useful discipline borrowed from production practice: make your POC long enough to capture at least one autoscale event and one simulated incident, so you see how the tool behaves under genuine stress rather than a tidy demo.
A filled-in sample scorecard row:
| Metric | Tool A | Tool B |
|---|---|---|
| Max VUs (single hybrid generator) | 22,000 | 48,000 |
| Scripting effort (time-to-first-script) | 6 hrs | 3.5 hrs |
| Accuracy delta vs. APM baseline | ±8% | ±3% |
| CI/CD hook (CLI/REST) | Yes | Yes |
| Cost-per-VU (per 1,000 VU-hrs) | $14 | $22 |
Numbers, not adjectives. That’s what makes the decision defensible to a skeptical VP.
Build vs. Buy: When Open-Source Suffices vs. Enterprise Needs
The honest decision rule: if you need >50,000 VUs, 100+ protocols, and SLA-backed support, buy enterprise. If you’re below ~5,000 VUs on standard HTTP with engineering capacity to maintain the stack, open-source likely suffices. RadView’s platform sits squarely in the first bucket – protocol breadth, hybrid generation, and vendor support are exactly what justify a license once you cross those thresholds. See open source testing tools guide for the open-source side of the trade-off.
Integrating Load Testing into CI/CD: Copy-Paste Recipes and Percentile Quality Gates
Most CI/CD guides describe the concept and stop. Here’s the code. First, the principle that should drive your gates: the Google SRE team is explicit that “most metrics are better thought of as distributions rather than averages… it’s entirely possible for most of the requests to be fast, but for a long tail of requests to be much, much slower. A simple average can obscure these tail latencies” [5]. Gate on p95/p99, never on the mean.
A GitHub Actions snippet that triggers a test via CLI and fails on a percentile breach:
jobs:
  load-test:
    runs-on: ubuntu-latest
    steps:
      - uses: actions/checkout@v4
      - name: Run load test
        run: webload-cli run --scenario checkout.wlp --vus 5000 --out results.csv
      - name: Evaluate quality gate
        run: |
          P99=$(awk -F, 'NR>1{print $4}' results.csv | sort -n | \
            awk '{a[NR]=$1} END{print a[int(NR*0.99)]}')
          ERR=$(awk -F, 'NR>1{s+=$5}END{print s/NR}' results.csv)
          if (( $(echo "$P99 > 800" | bc -l) )) || (( $(echo "$ERR > 0.001" | bc -l) )); then
            echo "Gate failed: p99=${P99}ms err=${ERR}"; exit 1
          fi
That gate fails the build if p99 > 800ms OR error rate > 0.1% at 5,000 VUs. The same logic ports to GitLab CI or Jenkins. RadView’s CLI and REST API make this trigger-and-export pattern straightforward, and CSV/OTLP export feeds the numbers into the same observability backend your monitoring uses – one source of truth. For pipeline metrics export, the official OpenTelemetry documentation covers OTLP. Our full pipeline walkthrough lives at integrating performance testing into CI/CD pipelines.

Setting Percentile-Based Pass/Fail Thresholds and Baselines
A concrete starting set: API p95 < 1.5s, p99 < 3s, error rate < 0.5% at 3,000 VUs. Then add a regression rule against history: fail if p95 regresses more than 10% versus the trailing 7-day baseline. This catches the slow creep that absolute thresholds miss—the change that's still "within SLA" but trending toward a breach. The SRE error-budget concept underpins this: it's "undesirable to insist that SLOs will be met 100% of the time," so allow a budget and use "the gap as an input to the process that decides when to roll out new releases" [5]. Your gate is that input, automated.
When to Run: Per-PR, Nightly, or Pre-Release
Balance feedback speed against pipeline cost with a cadence table:
| Trigger | Test type | VUs | Duration |
|---|---|---|---|
| Per-PR | Smoke load | 200 | 2 min |
| Nightly | Full load | 5,000 | 30 min |
| Pre-release | Soak/endurance | 3,000 | 4 hrs |
Per-PR tests must stay fast or developers will route around them; save the 4-hour soak for pre-release where leak detection matters most. This shift-left/shift-right balance is covered further in shift-left and shift-right in performance engineering.
Full-Stack Visibility: Unifying APM, RUM, and Observability with OpenTelemetry
For the SREs and observability engineers in the room: the goal is one correlated troubleshooting workflow, not four disconnected dashboards. The architecture flows RUM (browser/device) → APM (services/traces) → observability (logs/metrics/infra), stitched together by a single instrumentation standard.
OpenTelemetry is that standard. It’s “Open source, as well as vendor- and tool-agnostic,” with two governing principles: “You own the data that you generate. There’s no vendor lock-in,” and “You only have to learn a single set of APIs and conventions” [1]. That’s what lets RUM traces, APM distributed traces, and infra metrics share correlation IDs so a front-end symptom links to a back-end cause.
A real correlated example: RUM shows 4.5s Largest Contentful Paint on Safari for EU users. Synthetic and APM traces follow the same request and reveal the cause – a CDN cache-miss adding 2.8s on a regional edge node. The RUM trace flagged who and where; the distributed trace flagged why. Load-test metrics exported as CSV or OTLP land in the same backend, so the test that predicted this regression and the production telemetry that confirmed it sit on one timeline. (Caveat: end-to-end correlation requires consistent instrumentation across teams – if the front-end isn’t emitting trace context, the link breaks.) See the CNCF OpenTelemetry project overview.
RUM vs. Synthetic Monitoring: Real Users vs. Scripted Checks
RUM captures what real users actually experience – every device, network, and browser in your traffic. Synthetic monitoring runs scripted checks from fixed locations on a schedule, which is exactly what you want for measuring CDN effectiveness and catching regional outages before users do. Concrete example: synthetic checks showed 220ms in us-east versus 890ms in ap-south, pinpointing a CDN edge gap that no single-region test would have surfaced. Use RUM for ground truth, synthetic for controlled geographic coverage, and combine synthetic baselines with RUM data to design realistic load test scenarios.
A Reference Architecture: RUM → APM → Observability
Name the signal at each hop. RUM emits browser traces and metrics (page load, LCP, interaction latency). APM emits distributed traces across services. The observability layer aggregates metrics and logs from infrastructure – the time-series and log-aggregation roles many teams fill with open-source stacks. OpenTelemetry instrumentation provides one vendor-neutral pipeline so all of it correlates, and load-test data exports into the same pipeline via CSV or OTLP. One instrumentation standard, many backends, zero lock-in.
Frequently Asked Questions
What is the difference between APM and load testing tools?
Load testing tools generate synthetic traffic in a pre-production or staging environment on a schedule, so you discover capacity limits before users arrive. APM tools observe real user transactions in production, always-on. Different environment, different data type, different question answered – proactive versus continuous.
Do I need multiple performance tools or one integrated platform, and can load testing replace APM?
You almost always need both load testing and APM/observability, because one can’t substitute for the other – APM only sees traffic that already happened, and load testing can’t watch live production. The pragmatic pattern for most teams is one load testing tool plus one APM/observability stack, unified via OpenTelemetry so they share metrics. What matters more than tool count is whether your tools correlate into a single source of truth.
How do I choose between open-source and commercial tools, and what should I use in CI/CD?
The honest threshold: above ~50,000 VUs with 100+ protocol needs and a requirement for SLA-backed support, commercial/enterprise wins; below ~5,000 VUs on standard HTTP with capacity to self-maintain, open-source usually suffices. For CI/CD specifically, your non-negotiable requirement is a CLI or REST API to trigger tests and percentile-based quality gates (p95/p99) rather than averages – any tool without those two capabilities is a poor pipeline fit regardless of price.
Is it worth gating every pull request on a full load test?
No – and this is where teams over-engineer. Full load tests on every PR will slow developers down until they route around the gate entirely, which is worse than no gate. Run a 2-minute, 200-VU smoke test per PR to catch gross regressions, reserve the 5,000-VU full run for nightly, and save the multi-hour soak test for pre-release. Match the rigor to the risk


