WebLOAD:
Load-Testing at Scale Anywhere, Anytime
Since 1993, the WebLOAD load testing tool has helped businesses proactively test their systems, ensuring optimal performance across all scenarios.


Play Video
Companies that choose WebLOAD


1.
Scripts Creation
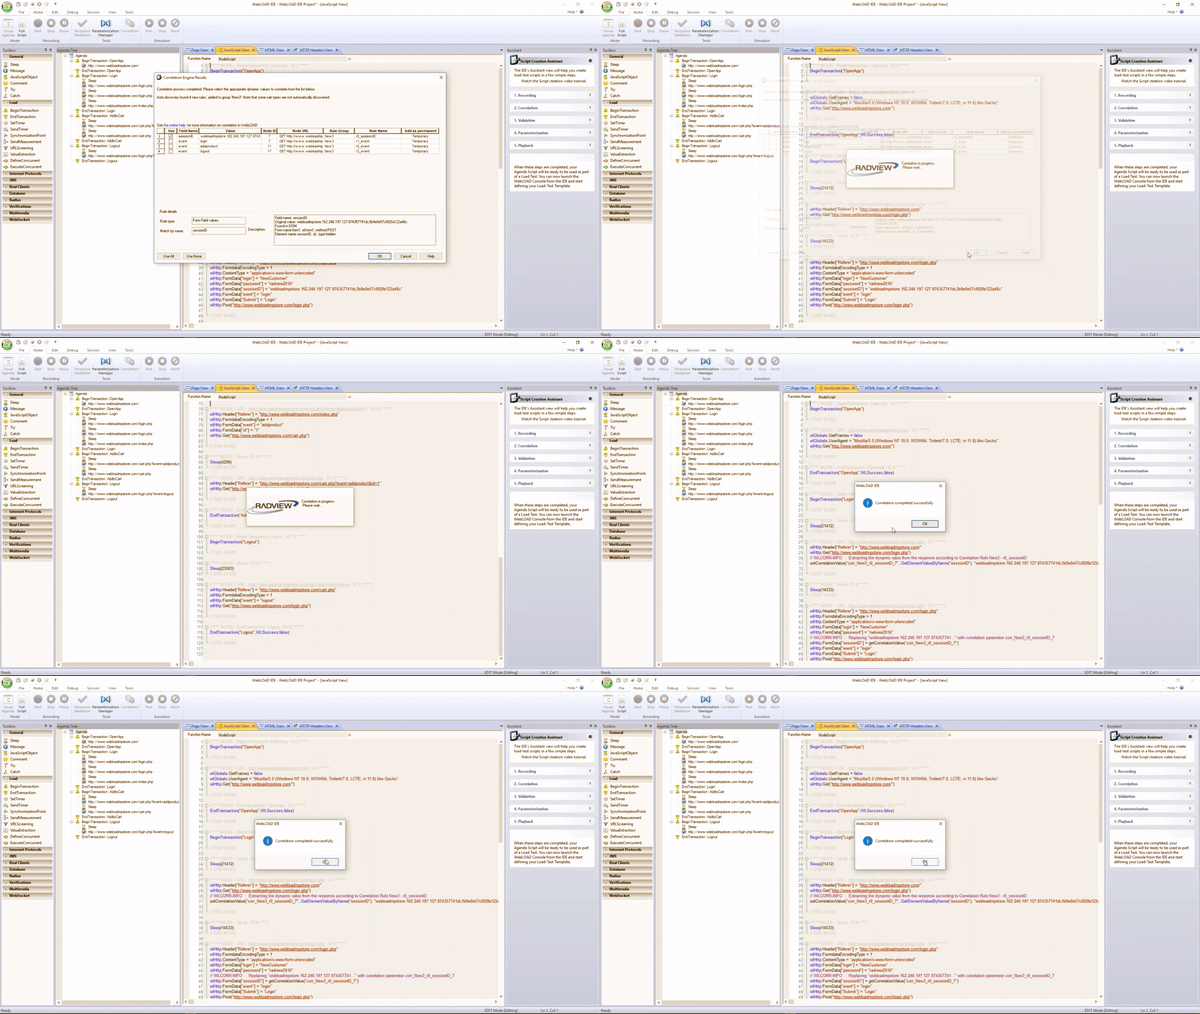
Harness WebLOAD’s correlation engine to effortlessly create robust scripts that automatically manage session-specific data, like IDs and tokens.
Extend your scripts seamlessly with JavaScript and Java for customized logic, supported by versatile protocol adaptability, including HTTP/S and WebSockets.
2.
Load testing execution
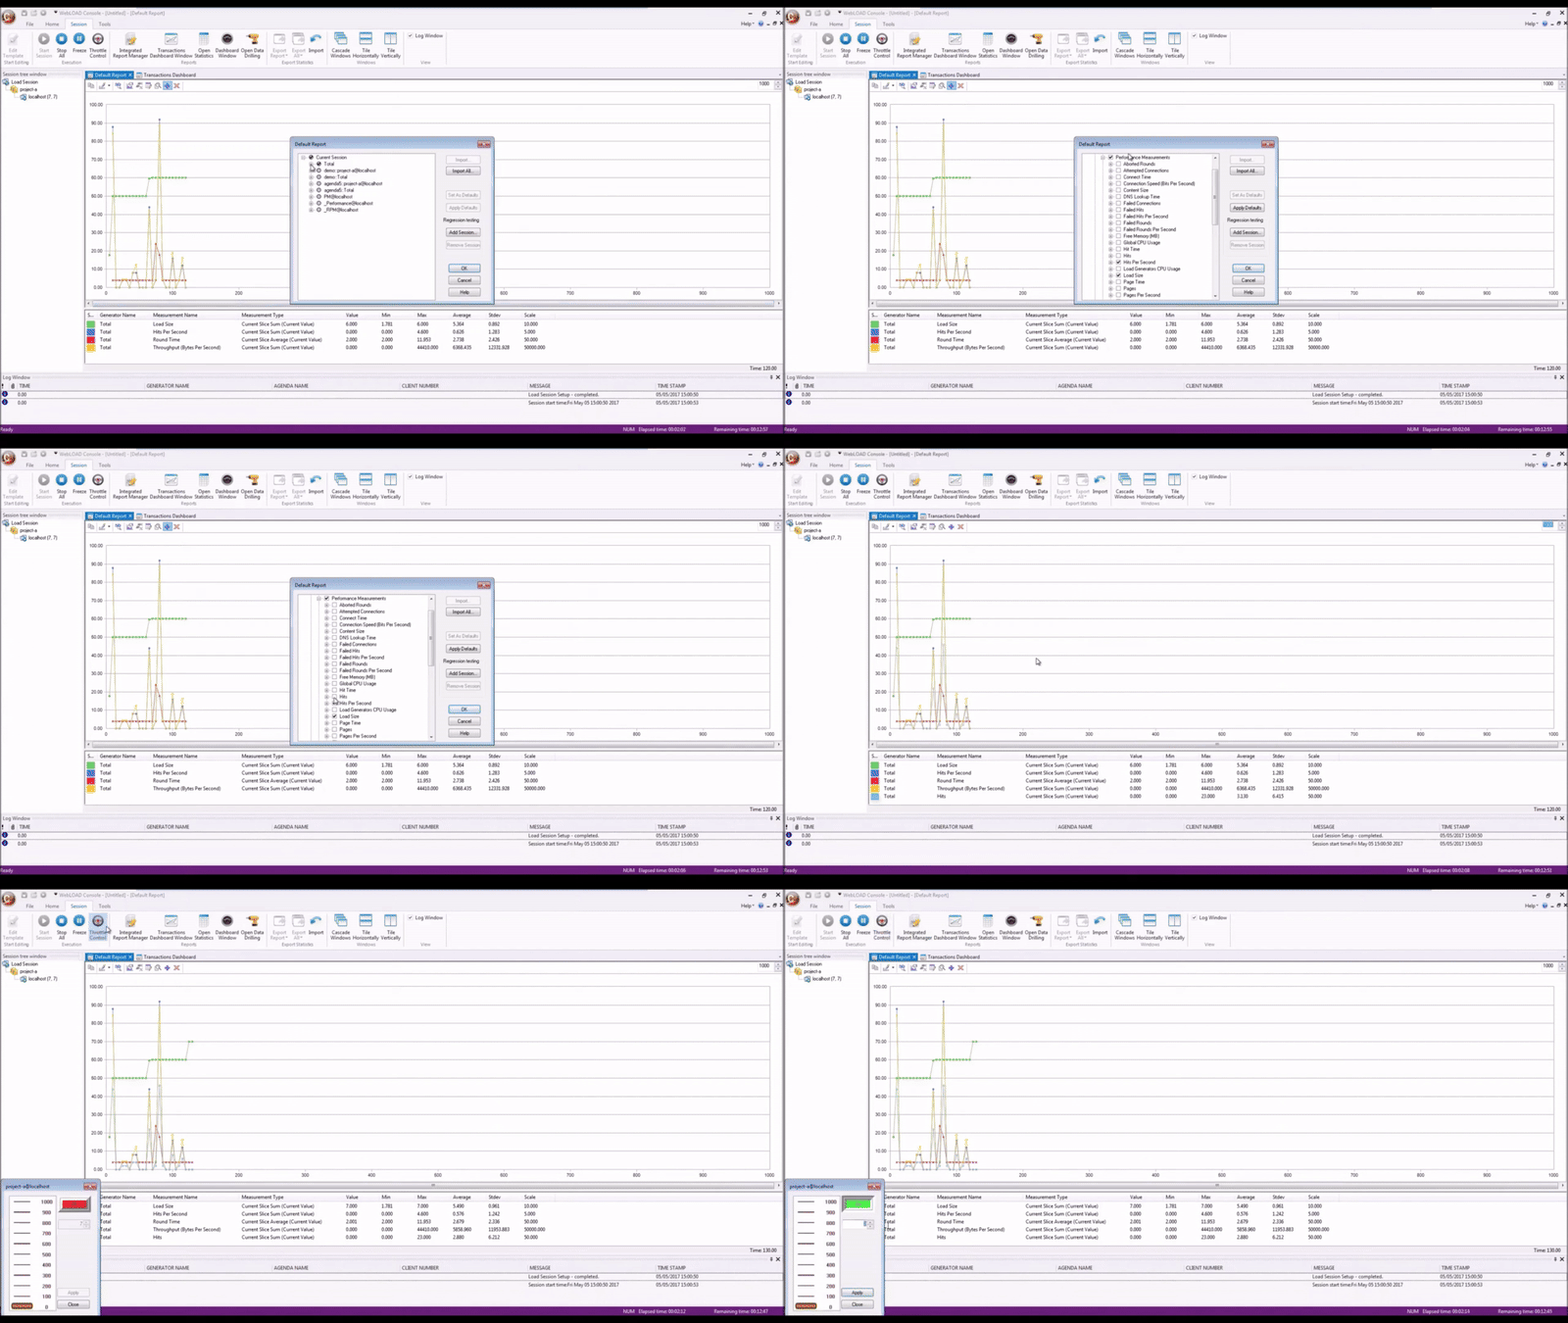
Opt for the ultimate flexibility with WebLOAD’s deployment options – cloud,
on-premises, or hybrid. Scale your testing seamlessly and capture critical server-side metrics to ensure your system’s performance and reliability under any load.


3.
Performance Analysis
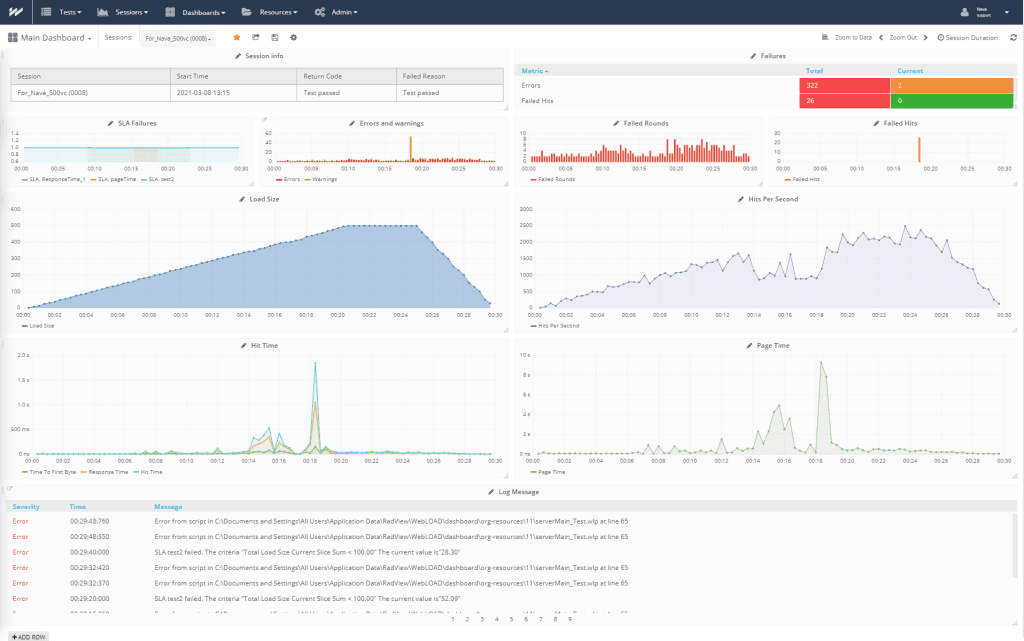
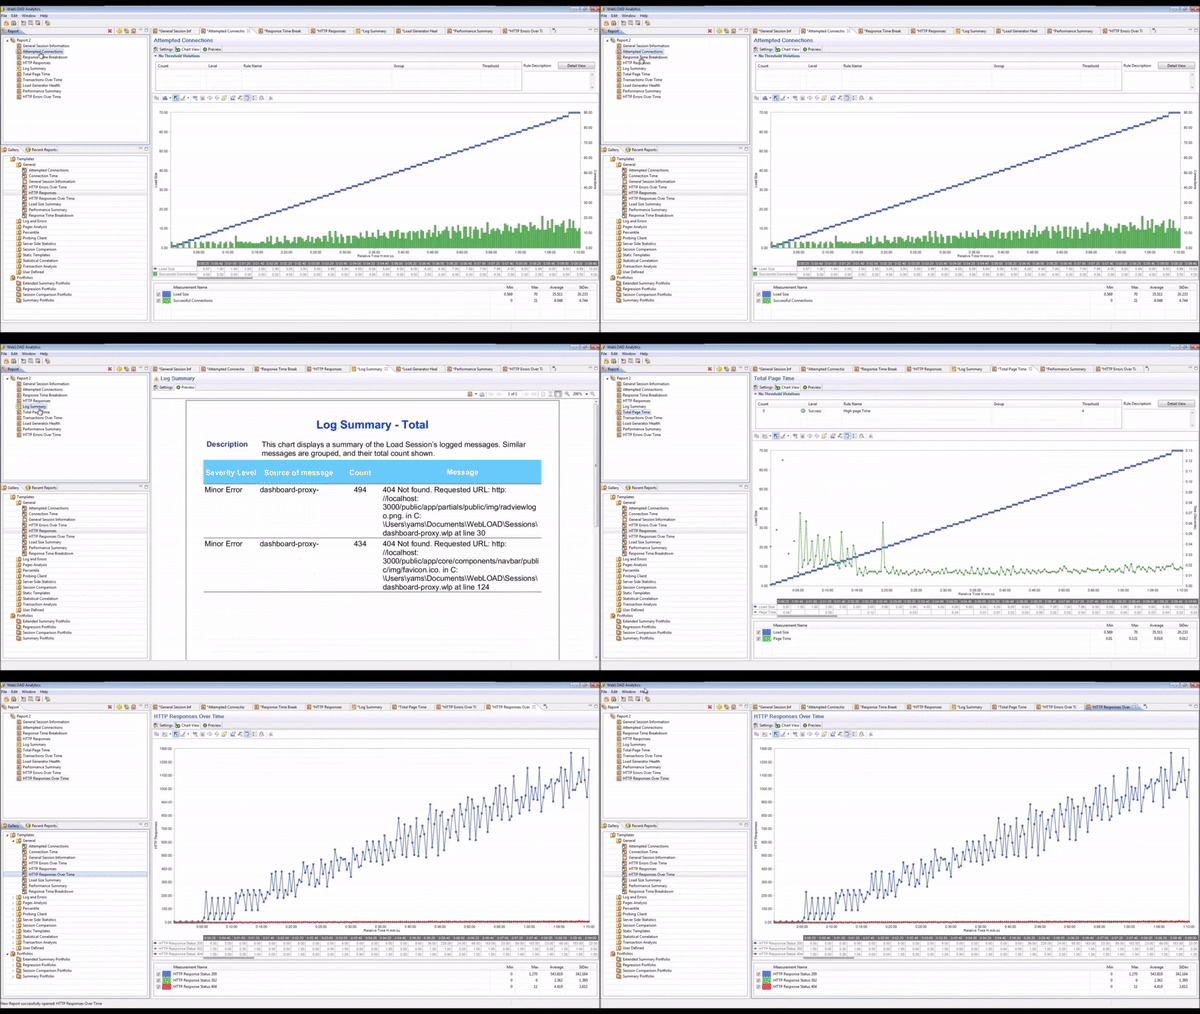
Maximize testing efficiency with WebLOAD’s analytics, offering real-time execution comparisons and a browser-based dashboard. the Webload Load testing tool Leverages AI-powered insights and ChatGPT integration for dynamic performance optimization.

End-To-End Load Testing Process

Create Powerful Scripts Save time & accelerate your go-to-market strategy
WebLOAD’s advanced tools automate dynamic values and protocol integration, simplifying complex scenario creation. Drag-and-drop functionality and JavaScript support boost script flexibility and strength.

Identify performance bottlenecks
Enhance system efficiency and optimize resource allocation.
WebLOAD’s analytics pinpoint exact bottlenecks, streamlining troubleshooting and system optimization.
fix issues.
fix issues.

Simulate realistic load scenarios
Validate application performance under real-world conditions
WebLOAD’s parameterization models user behaviors, offering precise simulations and insights for system optimization.

Powerful correlation engine.
Speed up script development and enhance test accuracy.
The engine automatically identifies and manages dynamic data, ensuring scripts are both efficient and reliable.

WebLOAD's Analytics Dashboard
Streamline Data analysis and improve decision-making
The dashboard provides real-time data visualization and in-depth analytics, facilitating quick identification of trends and issues.


