Performance Analysis
- Create load tests
- Execute and schedule test runs
- Upload, add and manage tests, resources, and sessions
- Analyze results using pre-defined and self-configured dashboards
- Share tests and results with peers
Realistic load generation
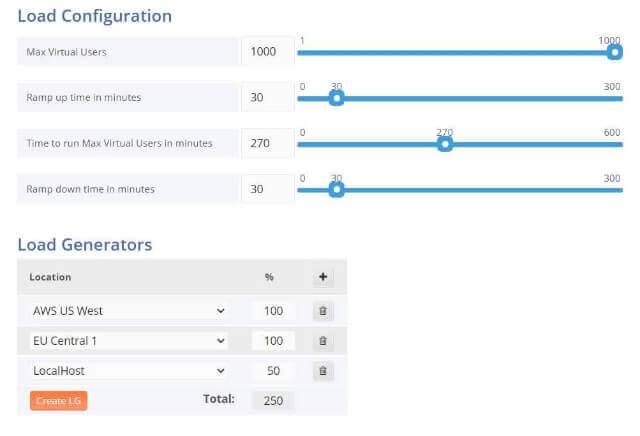
Create highly-customized text execution sessions using any volume of virtual users, running from any location (on-premise and the cloud), and using any logical flow to mimic real-life conditions.

Granular performance analysis
- Use out-of-the-box dashboards to view performance data from any possible angle, compare multiple sessions, and drill-down to specific transactions to pinpoint problems.
- Customize your own dashboards and define the exact layout, graphs, and data to be displayed.
- Collaborate with other team members by sending the URL of any dashboard.
Collect Client and User Experience Data
Provides a high-level view of test results, including failure counters, failures and errors over time, and other useful measurements. [Click image to expland]
Provides a high-level view of test results, including failure counters, failures and errors over time, and other useful measurements. [Click image to expland]
Provides a high-level view of test results, including failure counters, failures and errors over time, and other useful measurements. [Click image to expland]
Provides a high-level view of test results, including failure counters, failures and errors over time, and other useful measurements. [Click image to expland]
Drill down with APM tools
Use WebLOAD’s built-in integration with Application Performance Management (APM) tools and take root cause analysis one step further. Once you have identified a performance issue using WebLOAD, you can easily correlate the WebLOAD transaction to the server-side event in your APM tool.
WebLOAD provides built-in integration with Dynatrace, AppDynamics, New Relic, Nagios, and other APM tools.

