Your checkout page renders in 800 milliseconds in staging. Then traffic hits 500 concurrent users on launch day, and that same page crawls to 6 seconds – right as your conversion funnel fills with people who came to buy. By the time someone notices, you’ve already lost the sale. This is the gap that performance testing exists to close, and it’s a gap most teams discover in production rather than in a test environment.
Here’s what “good” actually looks like in 2025: the average US website serves its main content in roughly 1.9 seconds on mobile and 1.7 seconds on desktop, with 75th-percentile server response (TTFB) landing around 0.8 seconds on mobile and 1.2 seconds on desktop, according to DebugBear’s Website Load Time Statistics [1]. If your numbers are materially worse, you have a problem worth diagnosing. If they’re better, you have an advantage worth protecting under load.
The trouble is that most guides on this topic fail you in one of three ways. They cover front-end metrics or back-end metrics but never unify them. They still cite First Input Delay (FID), a metric Google retired in 2024. Or they’re thinly disguised tool listicles with no objective selection criteria. This guide does something different. You’ll get a full-stack decision architecture that maps every test type to a business outcome, a single metrics reference bridging Core Web Vitals with load metrics, a reproducible 7-phase workflow that includes the analysis phase competitors skip, a layer-by-layer bottleneck triage flow, a hybrid testing blueprint that validates SEO-critical vitals at scale, and a way to gate it all in CI/CD. By the end, you’ll know exactly which test to run, why, and how to prove it holds when real traffic arrives.
- What Is Web Performance Testing? A Definitive Framework
- Types of Web Performance Testing (and Which Business Outcome Each One Protects)
- Frontend vs. Backend Web Performance Testing: A Complementary, Layered Strategy
- The Unified Web Performance Metrics Reference (Core Web Vitals + Load Metrics in One Place)
- Diagnosing Slow Web Apps: The Layer-by-Layer Bottleneck Triage Flow
- Hybrid Protocol + Browser-Level Testing: The 95/5 Blueprint That Validates Core Web Vitals at Scale
- Web Performance Testing Tools Compared: A Criteria-Driven Decision Framework
- The 7-Phase Web Performance Testing Workflow (Reproducible, End-to-End)
- Integrating Performance Testing into CI/CD: Performance-as-Code and Build-Breaking Gates
- 12 Web Performance Testing Best Practices From the Field
- Frequently Asked Questions
- References and Authoritative Sources
What Is Web Performance Testing? A Definitive Framework
Web performance testing encompasses load testing (concurrency), speed testing (latency), and reliability testing (error rates) across the full request-response-render cycle. That single sentence is the taxonomy everything else hangs on. It’s distinct from functional testing, which asks “does the feature work?” Performance testing asks “does it work fast enough, for enough concurrent users, without falling over?” – three separate questions that demand three different test designs.
The browser-side measurement that makes web performance testing “web” rather than generic backend testing rests on standards from the W3C Web Performance Working Group. The Navigation Timing API exposes precise timestamps for each phase of a page load – DNS lookup, connection, request, response, DOM processing – while the Resource Timing API does the same for every individual asset (scripts, images, stylesheets) the page pulls in. These APIs are why a browser can tell you that a render-blocking stylesheet, not your server, is what’s delaying first paint.
For standardized definitions of test types and terminology throughout this guide, the ISTQB Performance Testing syllabus provides the industry-recognized vocabulary [2]. For the underlying browser measurement concepts, the MDN Web Performance documentation is a strong neutral reference.
Web Performance Testing vs. General Performance Testing
Generic backend performance testing measures how a server handles requests. Web-specific testing adds layers that backend-only testing ignores entirely. Two stand out. First, HTTP/2 and HTTP/3 multiplexing: HTTP/2 sends multiple requests over a single TCP connection, while HTTP/3 runs over QUIC (UDP-based) to eliminate head-of-line blocking at the transport layer – and your test must reflect which protocol your CDN actually negotiates, because the concurrency behavior differs. Second, client-side JavaScript execution: a single-page application might receive a fast server response, then spend two seconds parsing, compiling, and executing JavaScript before the user can interact. A protocol-level test that stops at the HTTP response would report that page as “fast” while real users stare at a blank screen.
The Three Pillars: Server, Network, and Client Performance
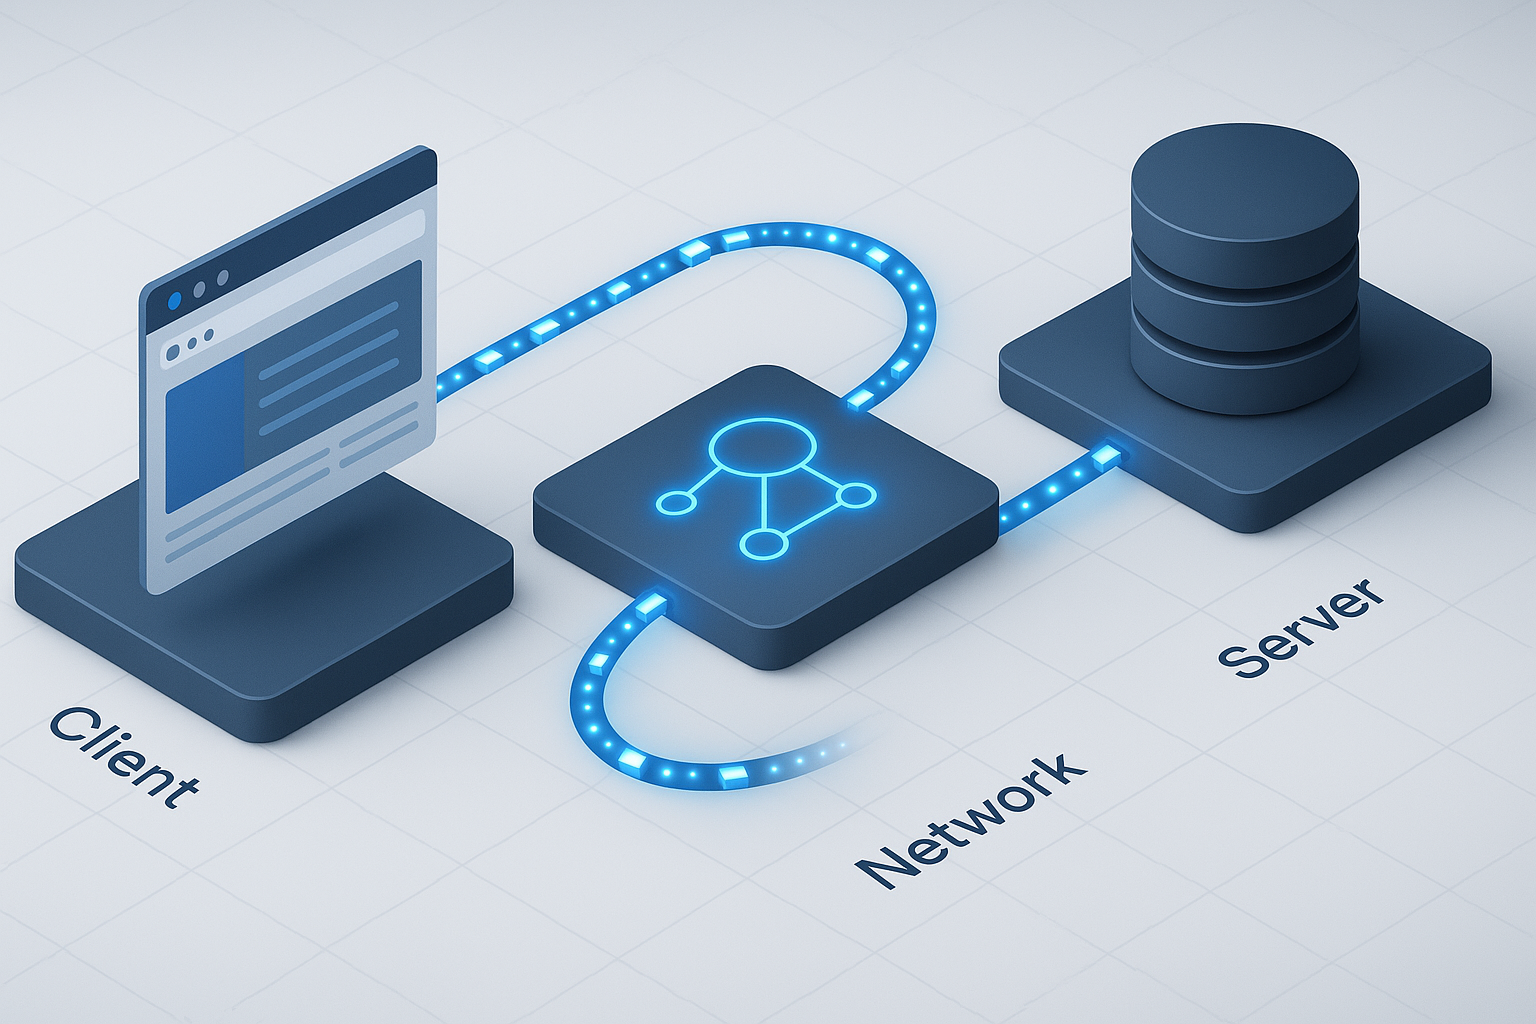
Every web request moves through three measurable layers, and each owns its own primary metric:
- Server (backend): response time – how long your application logic and database take to produce a response.
- Network (transmission): TTFB (Time to First Byte) – how long until the first byte arrives, which folds in CDN routing, TLS handshake, and connection setup.
- Client (browser rendering): LCP (Largest Contentful Paint) – how long until the largest visible element finishes rendering.

A useful mental model is a request-lifecycle diagram: a request leaves the browser, crosses the network to your CDN and origin (server pillar), the response travels back (network pillar), and the browser parses, executes, and paints (client pillar). A slowdown in any one pillar shows up to the user as the same symptom – a slow page – which is exactly why you need metrics that localize the cause. The MDN Web Performance documentation covers the client-side rendering pipeline in depth.
Types of Web Performance Testing (and Which Business Outcome Each One Protects)
Most guides list test types. Few tell you which business outcome each one defends. Here’s the matrix that does both:
| Test Type | Purpose | Key Metrics | When to Use | Example Scenario | Business Outcome |
|---|---|---|---|---|---|
| Load | Verify capacity under expected traffic | Concurrent users, throughput, p95 response time | Before launch, seasonal peaks | Black Friday e-commerce surge | Conversion / revenue |
| Stress | Find the breaking point | Max capacity, failure threshold | Capacity planning | DB connection-pool exhaustion | Outage prevention |
| Spike | Survive sudden surges | Recovery time, auto-scaling response | Event-driven apps | Product launch / flash sale | Uptime SLA |
| Endurance (soak) | Detect leaks and degradation | Memory/heap over time, error drift | Production stability | 24/7 SaaS app | Reliability / churn |
| Scalability | Validate horizontal scaling | Throughput per added node | Growth planning | Auto-scaling group sizing | Cost efficiency |
The mapping matters because it changes the conversation with stakeholders. “We should run a spike test” is abstract. “Our flash-sale uptime SLA is at risk unless we verify auto-scaling recovers within our window” is a business case. For high-scale load and spike scenarios where you need thousands of concurrent virtual users generated from cloud or on-prem infrastructure, enterprise-grade load generators like WebLOAD are built for that volume; open-source tools and SaaS platforms each suit different scale and budget profiles, which the tooling section unpacks. For a deeper breakdown of the 4 types of load testing and when each should be used, the distinctions carry real planning consequences.
Load vs. Stress vs. Spike: Disambiguating the Concurrency Tests
Picture a response-time-vs-concurrency curve. As you add virtual users, response time stays flat – then hits a “knee” where it climbs sharply. That knee is your saturation point.

- Load testing keeps you on the flat part of the curve, validating that expected peak traffic stays within SLA.
- Stress testing deliberately pushes past the knee to find where the system breaks. It uniquely exposes failures like database connection-pool exhaustion – where the app runs fine until the 201st concurrent transaction can’t get a connection and requests start queuing or erroring.
- Spike testing slams from low to very high concurrency in seconds, then watches recovery. It uniquely exposes auto-scaling lag: your infrastructure may scale eventually, but a 90-second scale-up window during a flash sale is 90 seconds of timeouts.
Endurance and Scalability: The Tests Most Teams Skip
Endurance (soak) testing is where the unglamorous, expensive failures hide. Run a moderate, steady load for 8 hours overnight, and watch resource consumption over time. A memory leak that’s invisible in a 20-minute load test reveals itself as a steadily rising heap that would eventually trigger an out-of-memory crash on a 24/7 SaaS application around day three of production. The confirming metric is straightforward: JVM heap (or process RSS) trending upward without returning to baseline after garbage collection. For more on how endurance testing in software surfaces these slow-burning defects, a dedicated guide walks through the methodology.
The Google SRE Book identifies saturation as one of its Four Golden Signals and notes that latency increases are often a leading indicator of it [3]. Soak tests catch saturation creep that point-in-time tests miss. For the methodology behind monitoring these signals, the Google SRE Book: Monitoring Distributed Systems chapter is the authoritative reference.
Frontend vs. Backend Web Performance Testing: A Complementary, Layered Strategy
This isn’t an either/or choice – it’s two layers that catch different failures. Backend testing measures server response, database query time, and API latency at the protocol level. Frontend testing measures browser rendering, JavaScript execution, and Core Web Vitals at the browser level. Map them to the request lifecycle: the backend layer uniquely catches a database query that degrades from 40ms to 900ms under concurrency, while the frontend layer uniquely catches a render-blocking script or a layout shift (CLS) that the protocol layer can’t even see.
The Grafana k6-learn educational module makes a key point that’s easy to miss: backend (protocol-level) testing is far less resource-intensive than browser-level testing, which makes it the practical choice for generating high load [4]. A protocol virtual user is essentially an HTTP client; a browser virtual user is a full Chromium instance consuming hundreds of megabytes of RAM. That cost difference drives the hybrid model later in this guide.
Covering both layers takes either a combined open-source stack (a protocol tool plus a browser tool) or a hybrid platform. RadView’s WebLOAD, for example, pairs protocol-level efficiency with native Selenium integration so the same project can generate scale and measure real browser rendering – and teams that need to extend Selenium for scalable load and functional testing get exactly that combination – but the principle matters more than any single tool: comprehensive web performance testing is full-stack by definition.
RUM vs. Synthetic Testing: Field Data Meets Lab Data
Synthetic (lab) testing runs scripted scenarios in a controlled environment – repeatable, debuggable, and perfect for catching regressions before deploy. Real User Monitoring (RUM) collects metrics from actual visitors in the field. They frequently disagree, and the disagreement is informative. Lighthouse (lab) might score your LCP at 1.8s on a fast simulated connection, while the Chrome User Experience Report (CrUX, field) shows a 75th-percentile LCP of 3.4s because real users are on mid-tier phones over congested mobile networks. When lab looks good but field looks bad, your test environment is too generous. Mature teams run both: synthetic to gate deploys, RUM to validate against reality. Google’s official Core Web Vitals documentation explains the field-versus-lab distinction in detail [5].
Why Backend Testing Generates Higher Load (and What That Costs You in Accuracy)
The capability gap is concrete: protocol-level tools cannot measure LCP, INP, or CLS, because those metrics only exist inside a rendering browser. The cost gap is equally concrete: a single browser virtual user can consume 50 – 100x the CPU and memory of a protocol virtual user. So if you need 10,000 concurrent users, an all-browser approach is economically painful and an all-protocol approach is blind to UX. This trade-off is precisely what the hybrid model resolves.
The Unified Web Performance Metrics Reference (Core Web Vitals + Load Metrics in One Place)
Here’s the reference competitors fragment across separate articles – front-end and back-end metrics together, with current thresholds:
| Metric | Layer | What It Measures | “Good” Threshold | Tool | Business Impact |
|---|---|---|---|---|---|
| LCP | Client | Loading | < 2.5s | Lighthouse / CrUX | Bounce, SEO |
| INP | Client | Interactivity | < 200ms (≤500ms needs work) | CrUX / RUM | Engagement, SEO |
| CLS | Client | Visual stability | < 0.1 | Lighthouse / CrUX | Trust, SEO |
| TTFB | Network | Server responsiveness | < 0.8s | WebPageTest | Leading LCP indicator |
| p95/p99 response time | Server | Tail latency | SLA-defined | Load tool | Worst-case UX |
| Throughput | Server | Requests/sec capacity | Capacity-defined | Load tool | Scale headroom |
| Error rate | Server | Reliability | < 0.1% | Load tool | Uptime SLA |
One correction that distinguishes current guidance from stale content: INP replaced FID as a stable Core Web Vital in 2024. If a guide still tells you to optimize FID, it’s out of date. For a fuller treatment of the performance metrics that matter in performance engineering, the relationship between response time, throughput, and error rates rewards a closer look.
Core Web Vitals Explained: LCP, INP, and CLS (and Why FID Is Gone)
Per Google’s official Web Vitals documentation, authored by Chrome team engineer Philip Walton, the three thresholds are: LCP within 2.5 seconds, INP of 200 milliseconds or less, and CLS of 0.1 or less, all measured at the 75th percentile of page loads [5]. INP (Interaction to Next Paint) is the successor to FID. As the Chrome team’s Jeremy Wagner and Barry Pollard explain, FID only measured the input delay of the first interaction, while INP observes all interactions on the page and reports the slowest, making it a far more honest measure of responsiveness [6]. The INP scale: below 200ms is good, 200 – 500ms needs improvement, above 500ms is poor. See Interaction to Next Paint (INP) explained by Google for the full breakdown.
Server-Side Load Metrics: Throughput, Percentiles, Error Rate, and Saturation
Averages lie. The Google SRE Book puts it bluntly: a service averaging 100ms at 1,000 requests per second can easily have 1% of requests taking 5 seconds – and “the 99th percentile of one backend can easily become the median response of your frontend” [3]. That’s why you report p95 and p99, not the mean. The book’s Four Golden Signals – latency, traffic, errors, saturation – are the minimal set to watch, and it specifically recommends measuring 99th-percentile response time over a short window as an early saturation signal. When your p99 starts climbing while throughput is flat, you’re approaching the knee in the curve.
Setting SLAs and Baselines for Web Applications
Translate metrics into commitments. A 99.9% uptime SLA permits roughly 43.8 minutes of downtime per month – 99.99% drops that to about 4.4 minutes, a difference with real architectural cost. Common response-time targets: under 2 seconds for e-commerce pages, under 1 second for financial transactions, under 500ms for API calls. Set baselines from three inputs: industry benchmarks (the 2025 figures above), competitive analysis (your rival’s measured load time), and business requirements (the latency at which your conversion rate degrades).
Diagnosing Slow Web Apps: The Layer-by-Layer Bottleneck Triage Flow
Start with a real scenario. Your pages render in under a second in development, but at 500 concurrent users in staging, response times balloon to 6 seconds. Where do you look? Random optimization wastes days. Structured triage finds it in an hour.
Against the 2025 baselines – average US main-content load of 1.9s mobile and 1.7s desktop, with 75th-percentile TTFB around 0.8s mobile and 1.2s desktop [1] – you can self-assess immediately. If your TTFB at low load is already 1.5s, the problem starts server-side before concurrency even enters the picture.
The triage maps each layer to a detection signal, the test that exposes it, and the metric that confirms it:
| Layer | Detection Signal | Test That Exposes It | Confirming Metric |
|---|---|---|---|
| Server/App | TTFB rises with concurrency | Load test, ramping VUs | p99 response time, CPU saturation |
| Database | Response degrades non-linearly past a VU count | Stress test | Query execution time, connection-pool wait |
| Front-end | TTFB fine, but LCP/render slow | Browser-level test | LCP, render-blocking resource count |
The Google SRE Book’s distinction between symptoms (the page is slow) and causes (a specific saturated resource) structures this logic [3]. For deeper profiling methodology, Brendan Gregg’s systems-performance work remains the reference standard for moving from “it’s slow” to “this specific subsystem is the constraint” [7], and our own guide to test and identify bottlenecks in performance testing translates that rigor into practical steps.
Is It the Front-End or the Back-End? A 60-Second Self-Diagnostic
A single branching rule localizes most problems fast. If TTFB exceeds ~0.8s but LCP is otherwise close to TTFB, the bottleneck is back-end – your server is slow to produce the first byte, and everything downstream waits. If TTFB is low but LCP is high, the bottleneck is front-end render-blocking: the server responded quickly, but the browser is stuck parsing CSS/JS or fetching the LCP image. This 60-second check tells you which half of your stack to investigate before you open a single profiler.
Symptom → Root Cause → Fix → Business Impact
| Symptom | Root Cause | Fix | Business Impact |
|---|---|---|---|
| Slow LCP | Render-blocking CSS/JS | Defer/async, inline critical CSS | Google research: 53% of mobile users abandon sites taking >3s |
| High TTFB | Slow DB query / no caching | Index queries, add caching layer | Akamai: a 100ms delay can cut conversions ~7% |
| Janky scrolling | Layout shifts (CLS) | Reserve image/ad dimensions | Reduced trust, higher bounce |
| Slow interactions | Heavy main-thread JS | Code-split, web workers | INP degradation, lower engagement |
The business numbers aren’t decoration – a 100ms delay correlating to a ~7% conversion drop (Akamai) means a back-end fix that shaves 300ms off TTFB has a measurable revenue line item.
Simulating Realistic User Behavior So Bottlenecks Actually Surface
Naive constant-rate load hammering hides bottlenecks because real users don’t behave that way. Three techniques make tests honest:
- Think time and pacing: insert randomized 2 – 10 second pauses between actions to mimic humans reading and deciding. Without it, you inflate throughput artificially and never reach realistic concurrency patterns.
- Parameterization: drive each virtual user with different data (unique logins, search terms, cart contents) so you’re not accidentally testing your cache instead of your app.
- Dynamic correlation: capture server-generated values – like a session token returned at login – and replay them in subsequent requests. Miss this, and every request after login fails with a 401, producing a “fast” test that proves nothing.
Looking ahead, peer-reviewed work like the ACM paper “User Behavior Simulation with LLM-based Agents” explores using LLM-driven agents to generate more realistic behavioral patterns [8]. It’s promising for scenario design, but with a clear guardrail: AI-generated scenarios still require human review to confirm they match your actual user analytics. This isn’t hands-off automation – it’s a way to remove toil from scenario drafting while an engineer validates the result, much like the discipline behind creating realistic load testing scenarios.
Hybrid Protocol + Browser-Level Testing: The 95/5 Blueprint That Validates Core Web Vitals at Scale
This is where the front-end/back-end and cost/fidelity threads converge into a single best practice. The hybrid model runs roughly 95% protocol-level virtual users and 5% browser-level virtual users. The protocol majority generates the load economically; the browser minority captures real UX metrics – including Core Web Vitals – under that load. Performance-testing practitioner Nicole van der Hoeven documents this protocol-majority/browser-minority pattern as the pragmatic standard for combining scale with real-browser fidelity [9].

The Cost-vs-Fidelity Trade-Off in Plain Terms
Think of it like polling. You don’t survey every voter to gauge public opinion – a well-chosen representative sample suffices. Here, a small slice of real-browser users gives you accurate Core Web Vitals while protocol users carry the load. The cost math is the reason: with browser VUs consuming roughly 50 – 100x the resources of protocol VUs, generating 10,000 users entirely in browsers might require dozens of expensive load-generator machines, while a 9,500 protocol / 500 browser split runs on a fraction of the infrastructure and still tells you whether LCP holds up when the system is busy.
Implementation Blueprint: Capturing LCP and INP Under Realistic Load
A concrete configuration: run 950 protocol virtual users executing your core API and page-fetch journeys, plus 50 browser virtual users (via Selenium integration in WebLOAD, or the browser module in k6) executing the same critical journey while measuring LCP and INP. The protocol slice saturates the system; the browser slice answers the question that actually matters for SEO – does LCP stay under 2.5 seconds when 950 other users are pounding the backend?
// k6 hybrid example (conceptual)
export const options = {
  scenarios: {
    protocol_load: { executor: 'ramping-vus', exec: 'apiFlow',
      stages: [{ duration: '5m', target: 950 }] },
    browser_uxcheck: { executor: 'constant-vus', exec: 'browserFlow',
      vus: 50, duration: '5m',
      options: { browser: { type: 'chromium' } } },
  },
  thresholds: { browser_web_vital_lcp: ['p(75)<2500'] },
};
That lcp < 2500 threshold ties your load test directly to Google’s official Core Web Vitals standard – proving the metric Google ranks on holds at scale, not just in a quiet lab.
Web Performance Testing Tools Compared: A Criteria-Driven Decision Framework
The categories matter more than any ranking. Here’s an impartial comparison across the axes that drive real decisions. Methodology note: scoring reflects documented capabilities and aggregated third-party review data from platforms like G2, TrustRadius, and PeerSpot – not marketing claims. (Disclosure: WebLOAD is a RadView product.)
| Tool | Protocol / Browser | Scale | CI/CD Depth | Cloud / On-Prem | Model |
|---|---|---|---|---|---|
| JMeter | Protocol (+plugins) | High | Strong | Both | Open source |
| Gatling | Protocol | High | Strong | Both | Open core |
| k6 | Protocol + browser module | High | Strong | Both | Open core |
| Locust | Protocol | High | Moderate | Both | Open source |
| Selenium/Playwright | Browser | Low | Moderate | Both | Open source |
| WebLOAD | Protocol + native Selenium | Very high | Strong | Both | Commercial |
| Legacy enterprise suites | Protocol + browser | Very high | Strong | Both | Commercial |
| APM platforms | Monitoring (not load) | N/A | Integrations | Cloud | Commercial |
Protocol-Level vs. Browser-Level vs. Hybrid: The Core Capability Axis
The single most decision-relevant question: does the tool render JavaScript and measure Core Web Vitals, or just exercise protocols? Protocol-only tools (JMeter, Gatling, Locust) scale beautifully but are blind to LCP, INP, and CLS. Browser-only tools (Selenium, Playwright, Puppeteer) measure real UX but don’t scale economically. Hybrid platforms (WebLOAD, and k6 with its browser module) span both, which is why they suit comprehensive backend-plus-frontend testing. The Grafana k6 documentation frames this protocol/browser/hybrid distinction as the foundational choice [4].
Selection Criteria Checklist: Matching the Tool to Your Stack
Run your candidates through these five questions:
- Scope: Do you need browser rendering and Core Web Vitals, or is protocol-level enough?
- Scale: How many concurrent users at peak – hundreds, or tens of thousands?
- Protocol support: Do you need REST, GraphQL, WebSockets, and gRPC?
- CI/CD: Does it integrate with your pipeline (Jenkins, GitHub Actions) with pass/fail gates?
- Budget & support: Open-source DIY, or commercial with vendor support and enterprise app coverage (SAP, Oracle, Salesforce)?
Scenario shorthand: API-only, high-scale, CI/CD-gated work points toward protocol-level open-source. Comprehensive backend-plus-frontend at enterprise scale points toward a hybrid platform. If you’re still weighing options, our guide on how to choose a performance testing tool lays out the key factors and questions to ask.
The 7-Phase Web Performance Testing Workflow (Reproducible, End-to-End)
Most guides stop at “run the test.” The value is in phases 6 and 7.
- Requirements Definition – Set SLAs: response time < 2s, error rate < 0.1%, throughput targets from analytics.
- Test Environment Setup – Build production-like infrastructure with realistic data volumes.
- Script Development – Record journeys, parameterize, correlate dynamic values.
- Test Execution – Run baseline → load → stress → endurance in sequence.
- Monitoring – Collect server, network, and client metrics in real time.
- Analysis – Identify bottlenecks via waterfall analysis and resource profiling.
- Optimization & Validation – Fix, re-test, re-baseline.
Phases 1 – 3: Define SLAs, Set Up the Environment, and Script Realistic Scenarios
Derive scenarios from real data, not guesses. If analytics show 60% of sessions are browse-only, 30% browse-then-search, and 10% complete a login→browse→checkout journey, your virtual-user distribution should mirror that 60/30/10 split. Digital.ai’s guidance emphasizes exactly this scenario realism – testing the journeys users actually take [10]. ISTQB terminology keeps the process documentation standardized across your team.
Phases 4 – 5: Execute the Baseline→Load→Stress→Endurance Sequence and Monitor
Always run a baseline first – a small, known load that establishes the flat part of your curve. Then ramp. During execution, capture server CPU and memory alongside p95 response time so you can correlate a latency spike to a saturating resource in the same timeline. The Google SRE Book’s Four Golden Signals tell you the minimum to watch [3]; see Monitoring Distributed Systems for the full framework.
Phases 6 – 7: Analyze Bottlenecks, Remediate, and Re-Test (the Phase Competitors Skip)
A worked example: a load test shows p99 response time hitting 4.2s at 400 users. Waterfall analysis points to a single un-indexed database query taking 1,800ms under concurrency. You add the index, the query drops to 35ms, and a re-test shows p99 falling to 680ms – comfortably inside SLA. That loop – analyze, fix, prove – is what separates a test that improves your system from a test that just produces a report. Brendan Gregg’s profiling methodology underpins the analysis rigor here [7].
Integrating Performance Testing into CI/CD: Performance-as-Code and Build-Breaking Gates
Performance testing that runs once before launch catches yesterday’s problems. Performance-as-code catches them on every pull request.
What Is Shift-Left Performance Testing (and Where Shift-Right Fits)?
Shift-left means moving performance checks early – a lightweight smoke perf test on every PR that runs 50 virtual users for two minutes and fails fast if a regression appears. Shift-right means production monitoring: RUM thresholds that alert when real-world LCP or error rates drift. The two are complementary – shift-left prevents regressions from shipping, shift-right catches what only real traffic reveals. The Google SRE Book’s monitoring principles anchor the shift-right side


