
Load testing is a critical facet of software development, as it ensures that a system, application, or website can handle the expected volume of traffic without compromising performance. When integrated into a Continuous Integration/Continuous Deployment (CI/CD) pipeline, load testing becomes even more significant because it enables developers to detect, diagnose, and rectify performance issues early in the development process. One of the crucial aspects of load testing is trend analysis, which helps teams identify and understand patterns, improvements, and regressions in system performance over time. This article delves deep into the intricacies of analyzing load testing trends using WebLOAD and highlights the importance and benefits of doing so.
The Importance of Analyzing Load Testing Trends
Before delving into the specifics of using WebLOAD for trend analysis, it’s crucial to understand why this process is so vital. Here are some key points:
Identifying Performance Patterns: Trend analysis allows teams to identify patterns in system performance. This could be anything from cyclic performance dips due to specific operations to trends showing how system enhancements have improved performance over time.
Catching Performance Degradation Early: Continuous monitoring of performance trends allows teams to detect and address any performance degradation early on. This is especially important in a CI/CD environment, where regular updates and changes to the system can introduce new performance issues.
Understanding System Scalability: Load testing trends also provide insights into a system’s ability to scale. By examining how the system performs under increasing load over time, teams can predict how it will perform as user numbers grow.
Ensuring Performance Consistency: Consistent performance is crucial for maintaining a good user experience. By analyzing trends, teams can detect inconsistencies and fluctuations in performance and take the necessary actions to rectify them.
Using WebLOAD for Analyzing Load Testing Trends
WebLOAD, a powerful load and performance testing tool, offers advanced analytics capabilities that provide a comprehensive view of your system’s performance. One of the ways it does this is by enabling the comparison of multiple load-testing sessions. Here is a more detailed guide on how to use this feature:
Step 1: Open WebLOAD Analytics without any specific session. This provides you with a blank canvas on which to compare various sessions.
Step 2: Navigate to the templates and select “Session Comparison”. Within this option, choose “Performance summary over session”. This will allow you to select various sessions for comparison.
Step 3: At this stage, you can select the range of reports or sessions you’d like to compare. Add them to “Selected sessions”.
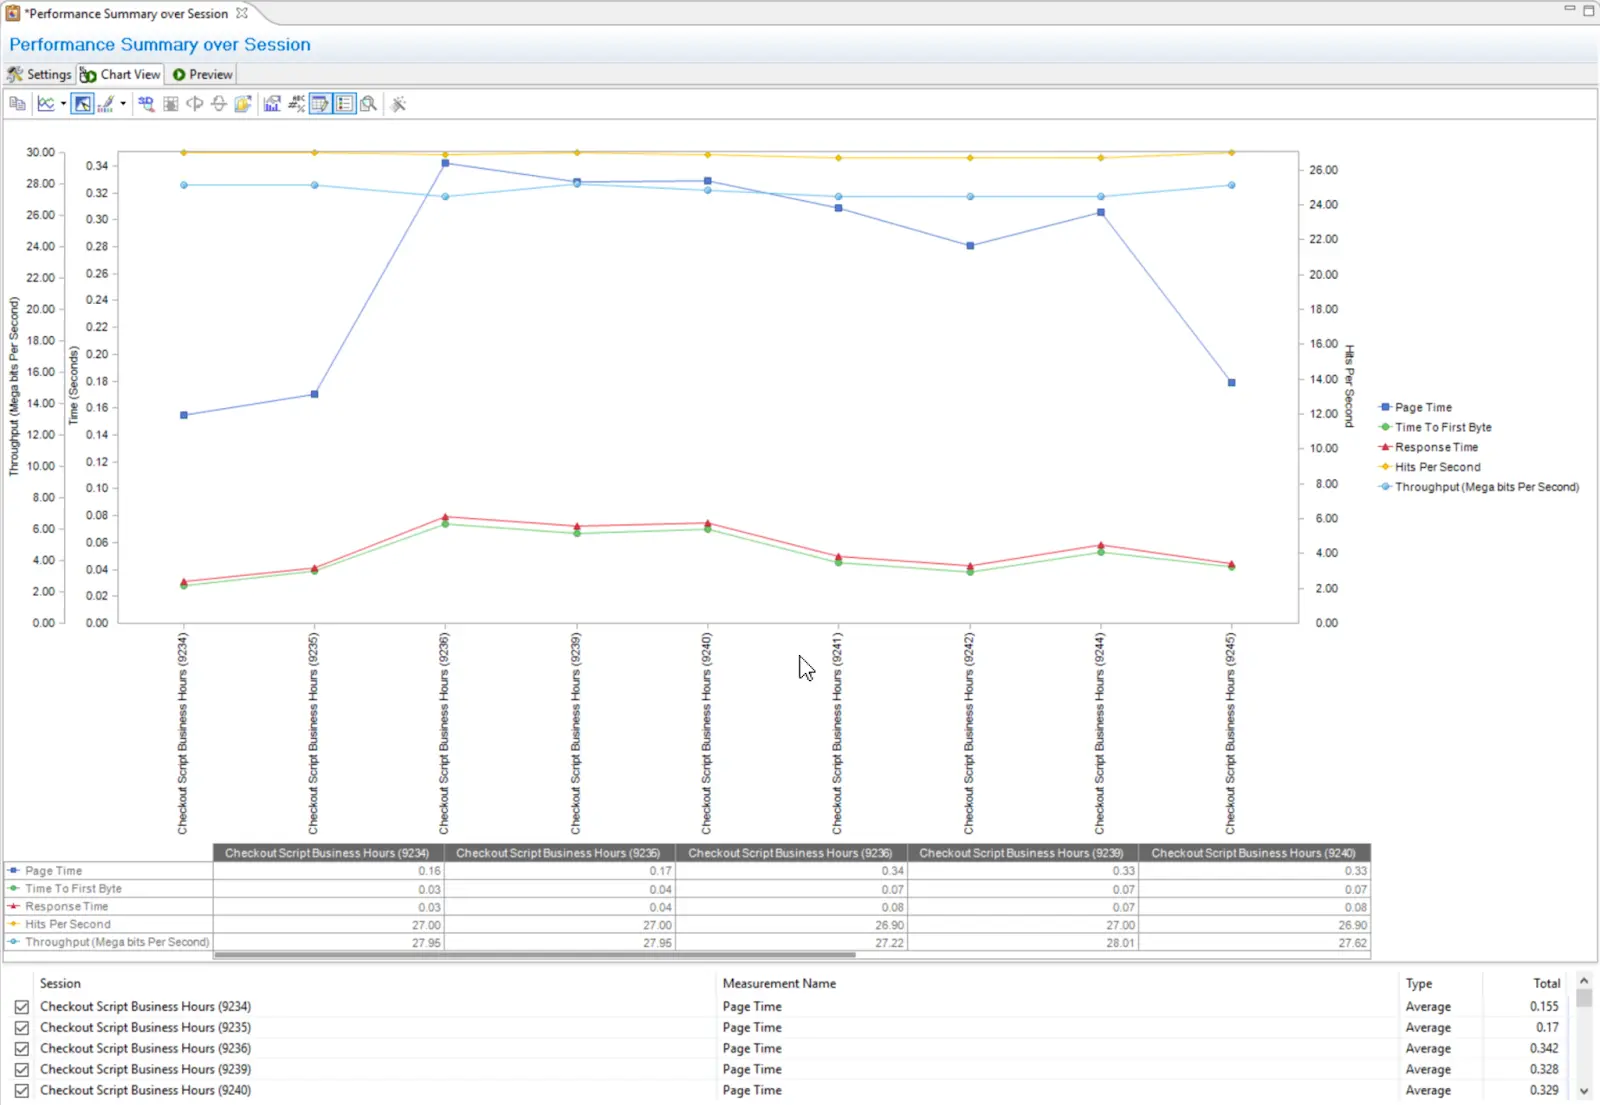
Step 4: After confirming the selected sessions by clicking ‘OK’, a comprehensive chart will be displayed. This chart’s Y-axis signifies time or rate, whereas the X-axis represents the chosen sessions.
Step 5: The chart provides you with five crucial data points for each session, namely:
- Page Time: The time taken for a page to load.
- Time to First Byte: The time taken from the user request to the first byte of the page being received by the browser.
- Response Time: The total time taken to send a request and receive a response.
- Hits Per Second: The number of requests made to the server per second.
- Throughput: The amount of data transferred from the server to the client in a given time.
Looking at the graph, the page time is the darker blue line in the upper area of the chart. The baseline value for page time (left end of the line) is about 150 milliseconds. The next session shows a value of around 160 milliseconds, which is still reasonable. Then the page time increases to about 340 milliseconds, which indicates something happened. Over the next 5 test sessions, there was little improvement but the last measurement returned page time to about 180 milliseconds, meaning something was fixed. The big change between sessions 2 and 3 signaled an issue.
Step 6: You can choose to add more data points as needed. This allows you to tailor the analysis to your specific needs and circumstances.
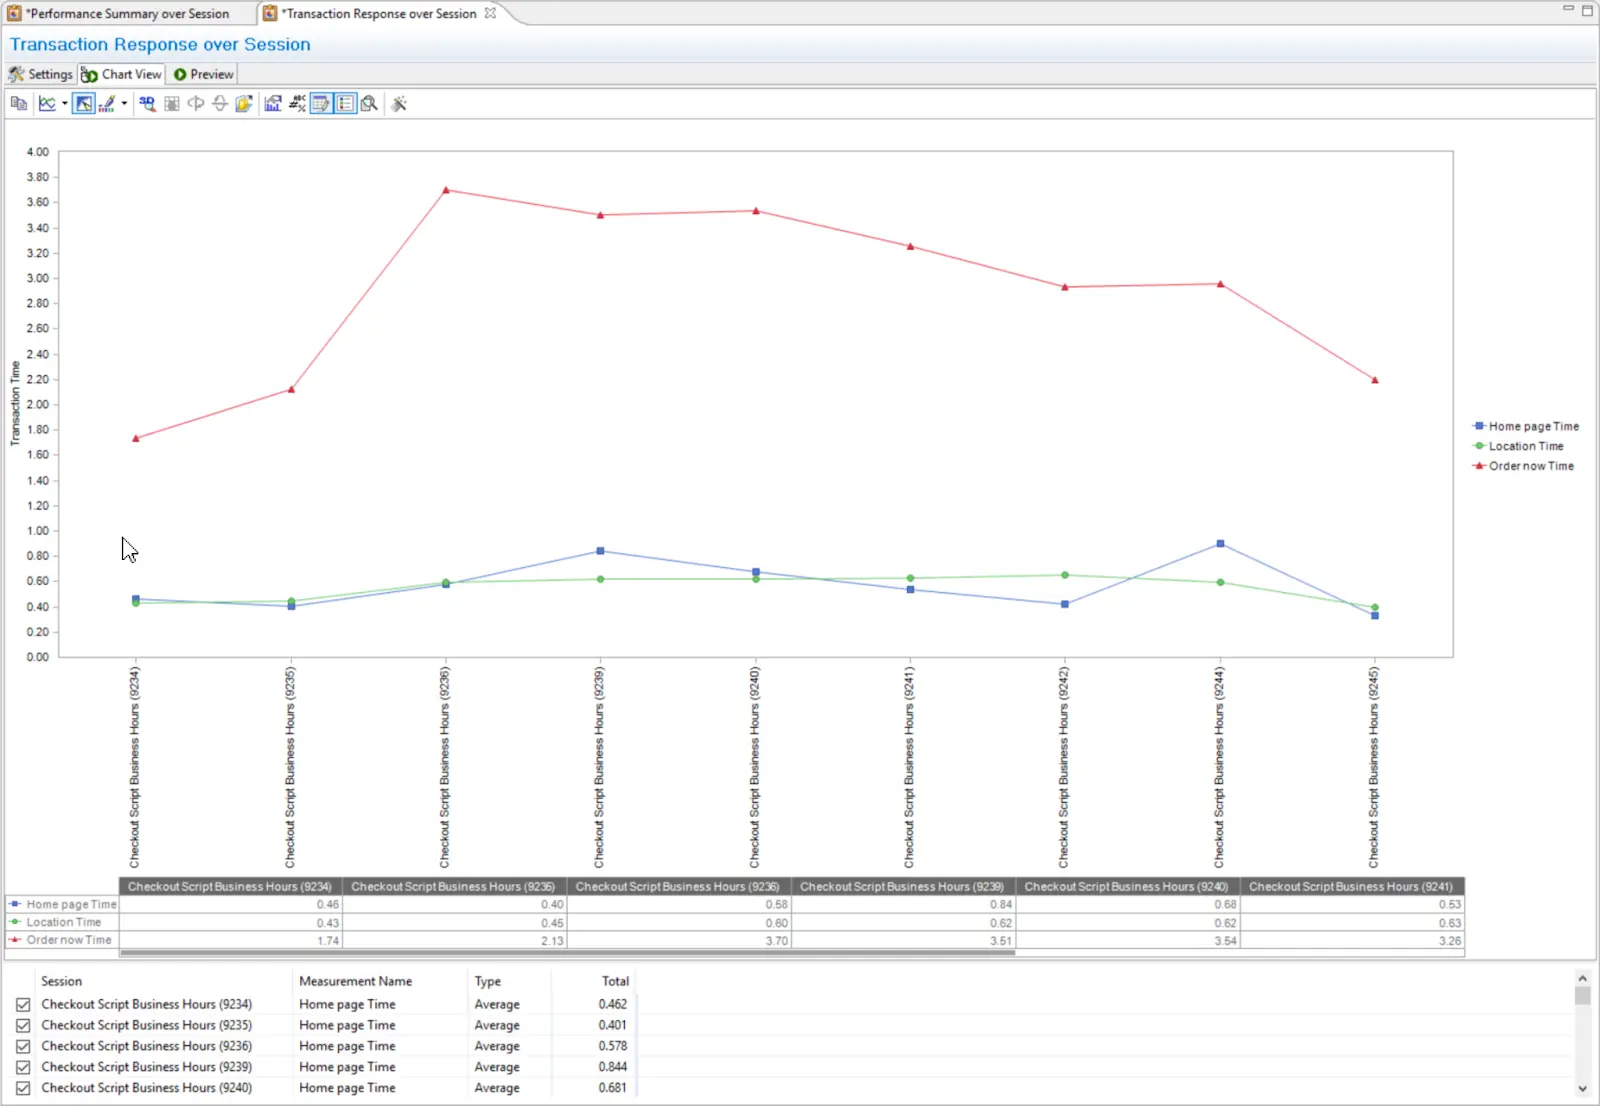
Apart from the “Performance summary over session”, WebLOAD also offers a “Transaction response over session” chart, which can be beneficial for getting a more granular view of specific transactions during the testing process.
This chart is for the same set of sessions as the example above. There are three transactions: “home page”, “location”, and “order now”. Across the sessions, “home page” and “location” look fine, as they are horizontal lines. However, the “Order now” transaction (red line) takes a big jump in session 3, corresponding to the increase in page time seen above. If we add more transactions, we may be able to drill down to a specific request. This report tells us which part of the application suffered and that provides focus for the dev and infra teams looking for the cause.
Visualizing Load Testing Trends in WebLOAD Dashboard
The WebLOAD Dashboard is another tool that provides a snapshot of load test trends, albeit with a slightly different approach. Here’s how to use it:
Step 1: Open the WebLOAD Dashboard and click on ‘sessions’ to select a single baseline session.
Step 2: Navigate to ‘Dashboards’ in the drop-down menu and select ‘Add New’. This action prompts you to create a new dashboard.
Step 3: In this new dashboard, you can include various metrics such as page time, time to first byte, and response time.
Step 4: Click the ‘Axis’ tab. Under the ‘X-axis’ option, select ‘Mode: Series’ and ‘Value: Avg’. This change results in a bar chart showing multiple sessions.
Though this visualization provides similar information, it is more condensed, which might make it harder to read for some users.
Integrating WebLOAD with Jenkins for Enhanced Analysis
Jenkins, a popular CI/CD tool, can integrate with WebLOAD for improved performance analysis. By utilizing Jenkins’ WebLOAD plugin, teams can compare a specific run with N previous runs, generating a detailed comparative report. Here’s a step-by-step guide on setting it up:
Step 1: Start by opening WebLOAD Analytics without any specific data.
Step 2: Create a new portfolio. This could be named, for instance, “Jenkins test”.
Step 3: Add the “Session Comparison | Performance Summary over Session” template to your portfolio.
Step 4: Close WebLOAD Analytics and navigate to Jenkins.
Step 5: In Jenkins, create a new project, for example, “WebLOAD test”.
Step 6: The next step is to add a load test. This process generates a series of results that can be compared over time.
Step 7: Now, add an analytics run that reads the results from the load test. This action requires specifying the output format as PDF, entering the portfolio name and report name (both without double quotes), and defining the number of previous builds to compare with.
Step 8: Finally, click ‘Save’ and run it. This process should generate a comprehensive report that compares the current run to previous ones.
Conclusion
The process of analyzing load testing trends is a critical aspect of maintaining and improving system performance. Through trend analysis, teams can gain invaluable insights into the performance and scalability of their systems, facilitating proactive performance management and ensuring a better user experience. Using tools like WebLOAD in combination with CI/CD practices allows for continuous monitoring and improvement of system performance, making it an integral part of any effective development cycle.
Here at Radview, we are a leading provider of enterprise-grade software testing solutions and offer a powerful platform for fast, easy, and reliable load testing.
To find out more about our differentiated technology and world-class support, reach out here.


