A system that sailed through months of QA, code review, and integration testing went down seventeen minutes into a product launch. The post-mortem didn’t find a bug. It found an assumption: the team had load-tested the application at 2,000 concurrent users and declared it ready. What they never tested was whether the system could scale — whether adding infrastructure under rising demand would translate into proportional throughput gains, or whether a connection pool bottleneck at the database layer would choke the entire stack once traffic crossed a threshold nobody had measured.
That gap — between “it passed load testing” and “it will scale” — is where production outages live.
This guide closes that gap. It is not a glossary of testing terminology or a product-comparison listicle. It is a practitioner-grade playbook for QA leads, performance engineers, SREs, and DevOps managers who need to diagnose actual bottlenecks, execute rigorous scalability tests across cloud and on-prem environments, validate that auto-scaling policies fire and function correctly, and prove system capacity before real users ever stress it. You’ll walk away with a diagnostic framework for bottleneck identification, step-by-step test designs for horizontal and vertical scaling validation, a complete auto-scaling verification protocol, and a best practices checklist — all grounded in authoritative sources and field-tested methodology.
- What Is Scalability Testing? (And Why Most Teams Get It Wrong)
- Diagnosing Scalability Failures: A Practitioner’s Guide to Bottleneck Identification
- Horizontal vs. Vertical Scaling: Designing Tests That Prove Your Strategy Works
- Auto-Scaling Validation: Proving Your Cloud Scaling Rules Actually Work Under Load
- Scalability Testing Best Practices Checklist
- Frequently Asked Questions
- References and Authoritative Sources
What Is Scalability Testing? (And Why Most Teams Get It Wrong)
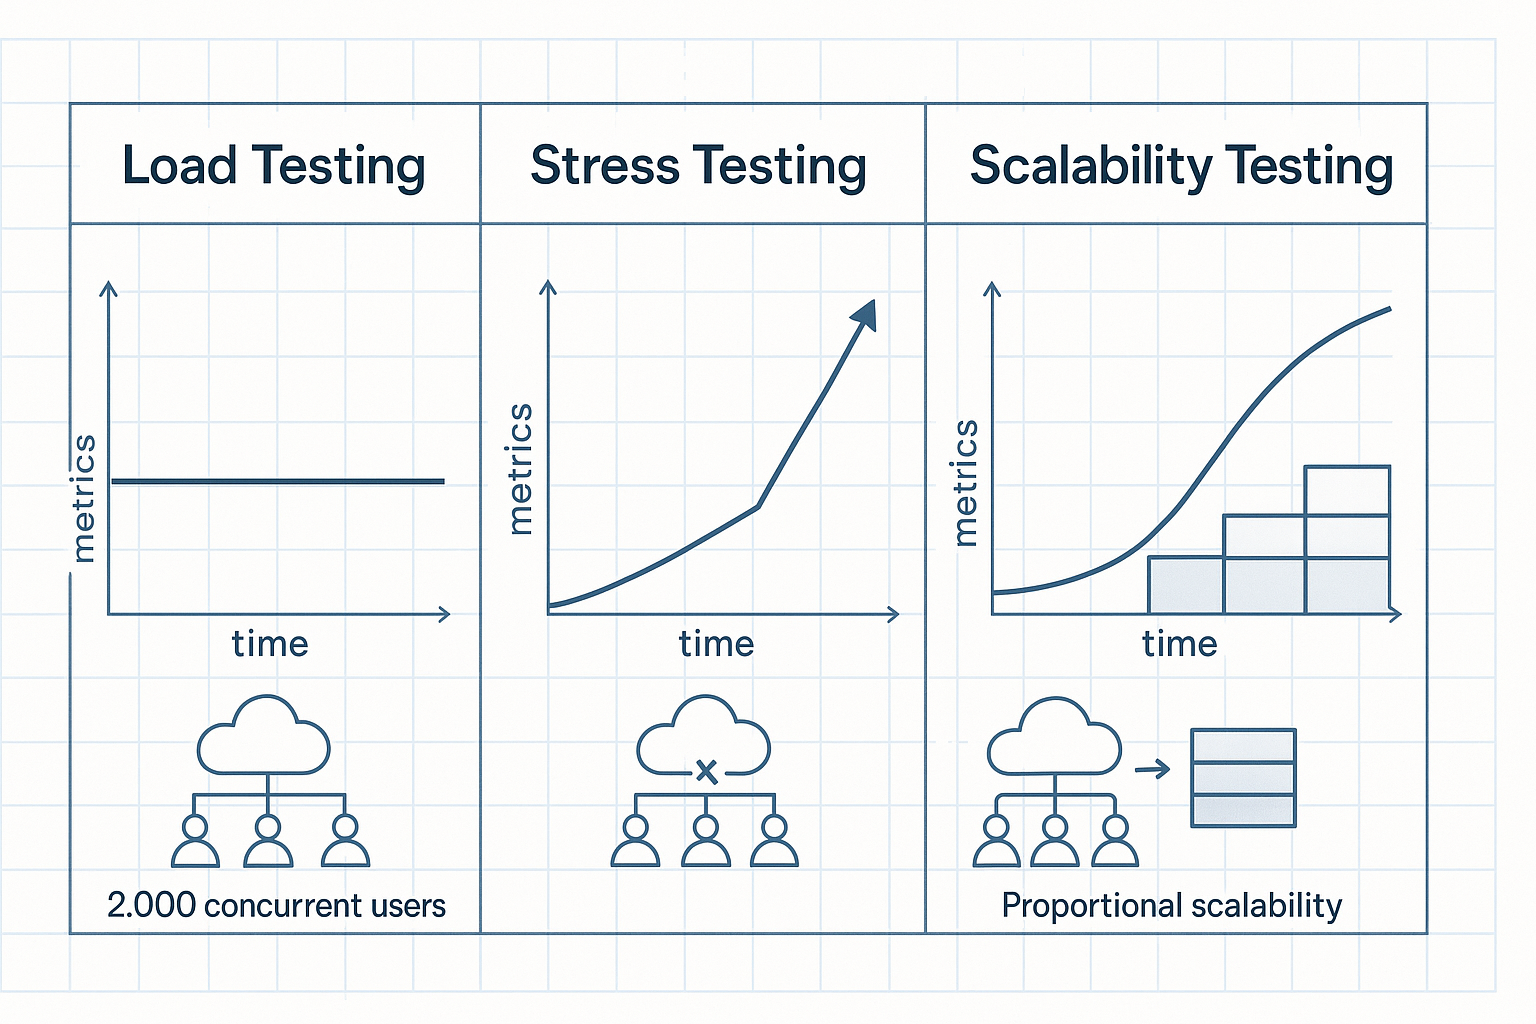
Scalability testing determines how — and at what rate — a system’s performance characteristics change as workload grows and resources are added. That second clause is what separates it from every other testing discipline. A load test confirms behavior at a fixed capacity. A stress test finds the breaking point. Scalability testing models the efficiency relationship between additional resources and additional throughput, answering a fundamentally different question: if we double the infrastructure, do we get double the output?
The Google SRE Book (Chapter 17, authored by Alex Perry and Max Luebbe) draws the distinction clearly: “Engineers use stress tests to find the limits on a web service. Stress tests answer questions such as: How full can a database get before writes start to fail? How many queries a second can be sent to an application server before it becomes overloaded, causing requests to fail?” [1]. That same chapter frames performance testing as the discipline ensuring “a system doesn’t degrade or become too expensive” over time [1]. Scalability testing occupies neither of those lanes — it measures the scaling function itself, asking whether a system’s architecture permits efficient growth.
Scalability Testing vs. Load Testing vs. Stress Testing: The Definitive Comparison

| Dimension | Scalability Testing | Load Testing | Stress Testing | Performance Testing |
|---|---|---|---|---|
| Primary Question | Does throughput scale proportionally with added resources? | Can the system handle the expected production workload? | At what point does the system fail? | Does the system meet speed, stability, and cost baselines over time? |
| Workload Model | Incrementally increasing load with stepped resource additions (e.g., 500→5,000 VU across four scaling steps, adding one server per step) | Fixed at expected peak (e.g., 2,000 concurrent users for 60 minutes) | Ramp beyond expected capacity until failure (e.g., 10,000 VU against a system designed for 3,000) | Sustained production-representative load over extended duration |
| Pass/Fail Criterion | Throughput efficiency ≥ 85% per added resource unit; p95 latency deviation ≤ 15% across scaling steps | p95 response time < SLA threshold (e.g., < 300ms); error rate < 0.1% | System recovers gracefully after limit is exceeded; MTTR < defined threshold | No degradation trend over test window; cost per transaction within budget |
As the SRE Book notes, finding bugs with zero MTTR (Mean Time To Repair) during testing directly raises the MTBF (Mean Time Between Failures) users experience in production [1]. Scalability testing finds the class of failures that only manifest under growth — the ones that are invisible at fixed load. For a deeper understanding of how these testing disciplines relate to one another, see this overview of different types of performance testing explained.
The Scalability Curve: Understanding Efficiency, Ceiling, and Degradation Zones

Every system under scalability testing traces a characteristic curve across three zones:
- The Linear Efficiency Zone: Resources and performance scale proportionally. Doubling virtual users from 100 to 200 increases throughput from 500 to approximately 980 req/s with p95 latency holding steady at 120ms. This is the zone where the architecture is working as designed.
- The Diminishing Returns Zone: Overhead costs (context switching, serialization, inter-service communication) begin eroding gains. Adding 100 more users might increase throughput from 980 to only 1,150 req/s while p95 latency climbs to 220ms. The system is still functional but scaling inefficiently.
- The Degradation Zone: Performance collapses. Adding 100 more users drops throughput to 400 req/s while p99 latency spikes to 4,000ms. This is where Colm MacCárthaigh, Senior Principal Engineer at AWS, identifies the onset of what he calls the “spiral of doom” in the Amazon Builders’ Library: the system gets slower, clients retry, which makes it slower still [2]. The boundary between diminishing returns and degradation is precisely the inflection point scalability testing must locate and document.
Why Scalability Testing Matters: The Business and Reliability Case
NIST Special Publication 800-145 defines one of cloud computing’s five essential characteristics as “Rapid Elasticity” — the capability to be “elastically provisioned and released, in some cases automatically, to scale rapidly outward and inward commensurate with demand” [3]. Every organization deploying cloud infrastructure is architecturally promised that elasticity. Scalability testing is the verification step that confirms the promise holds under real load.
Without that verification, teams face three concrete risks. First, the retry-amplification cascade MacCárthaigh describes [2]: during a traffic spike, a slow system generates retries that compound load, which slows the system further — a self-reinforcing loop that turns a 30-second scaling lag into a minutes-long outage. Second, infrastructure over-provisioning: when scalability limits are unknown, teams compensate with 2–3x over-provisioned capacity, wasting thousands of dollars monthly on resources that exist only because nobody tested where the actual ceiling lies. Third, SLA violations during the exact moments that matter most — product launches, flash sales, seasonal peaks — because the system’s scaling behavior was assumed, not measured.
Diagnosing Scalability Failures: A Practitioner’s Guide to Bottleneck Identification
Knowing that your system degrades at scale is the starting point, not the answer. The diagnostic question is where the constraint lives. As the Google SRE Book observes, “individual components don’t gracefully degrade beyond a certain point — instead, they catastrophically fail” [1]. A structured investigation framework prevents teams from chasing symptoms while the root cause compounds — for a deeper dive into systematic bottleneck diagnosis, see this guide on how to test and identify bottlenecks in performance testing.
Use this tiered diagnostic sequence during scalability test analysis:
- CPU sustained > 85% across all cores for > 60 seconds at target load? → CPU-bound bottleneck. Investigate compute-intensive operations, unoptimized queries, or excessive logging.
- DB query latency > 500ms at scale while CPU is below threshold? → Database bottleneck. Check query execution plans, index coverage, and lock contention.
- Connection errors or timeout spikes appearing? → Connection pool saturation. Examine pool size, connection hold times, and concurrent request volume.
- CPU plateauing at 40–50% while response times climb? → Thread contention or application-layer serialization. The infrastructure has headroom; the code doesn’t use it.

CPU, Memory, and Network Bottlenecks: Signals, Thresholds, and Remediation Patterns
CPU bottlenecks manifest as sustained utilization above 85% across all cores for more than 60 seconds under target load. The diagnostic distinction matters: high user CPU time points to application computation; high system CPU time suggests kernel-level overhead (excessive context switching, I/O wait). Remediation: optimize hot code paths, implement caching layers, or — if the code is already efficient — scale vertically or horizontally.
Memory bottlenecks appear when heap utilization exceeds 80% with garbage collection pause times exceeding 200ms. The telltale signal in test data is periodic latency spikes that correlate exactly with GC activity. If memory consumption grows monotonically throughout the test run regardless of load pattern, suspect a memory leak — a problem that scaling amplifies rather than solves.
Network bottlenecks show up as packet retransmit rates exceeding 0.5% or network interface utilization above 70%. In microservices architectures, east-west traffic between services can saturate internal network capacity before external bandwidth becomes an issue. WebLOAD’s integrated server-side monitoring surfaces CPU, memory, and network telemetry alongside client-side response time data in a single dashboard, making it possible to correlate a p99 latency spike with the exact resource that saturated at that moment.
Database Bottlenecks and Connection Pool Saturation: The Hidden Scalability Killer
Database connection pool saturation is the most frequently overlooked scalability constraint — and the one most likely to bring down an application that performs perfectly at moderate load. Even mature engineering organizations encounter it: GitLab has publicly documented operational runbooks for diagnosing application-DB connection pool saturation in their registry services [4].
Here’s the mechanism: a connection pool of 20 connections serving 500 concurrent users means 480 requests are queued at any given moment, producing average connection wait times of 2,300ms and a 12% connection timeout error rate. The cascade follows MacCárthaigh’s spiral pattern [2]: slow DB responses hold connections longer, which reduces pool availability, which slows more requests, which extends hold time further.
A practical pool sizing heuristic: pool_size = (core_count × 2) + effective_spindle_count. For a 4-core server with SSD storage (spindle_count ≈ 1), that yields a pool of 9 connections — far smaller than most defaults. The counterintuitive finding is that smaller, correctly sized pools with appropriate timeouts often outperform oversized pools that mask contention until catastrophic load.
N+1 query patterns compound the problem at scale. An API endpoint that executes 1 query at 10 users executes 50 queries at 50 users if each request triggers a lazy-loaded child query. Monitor total DB query count per transaction during scalability ramps — if it grows linearly with user count rather than staying constant, an N+1 pattern is present.
Thread Contention and Application-Layer Bottlenecks: When the Code Itself Doesn’t Scale
When CPU utilization plateaus at 40% while response times climb under increasing load, the bottleneck isn’t infrastructure — it’s the application code. Amdahl’s Law quantifies the limit: if 30% of application logic is serialized (synchronized blocks, single-threaded processing stages, global locks), no amount of horizontal scaling can improve throughput beyond 3.3× the single-core baseline, regardless of how many servers you add.
Thread pool exhaustion and blocking I/O are the most common culprits. A synchronous HTTP client that blocks a thread for 200ms per external API call at 10 concurrent users is fine; at 500 concurrent users it exhausts a 200-thread pool, and every subsequent request queues. Transaction-level performance analytics reveal this pattern: per-transaction latency increases linearly with concurrency while aggregate CPU stays flat. Understanding which performance metrics matter most is critical for isolating these application-layer constraints from infrastructure issues.
Stateful session management creates a different class of scaling failure — one that blocks horizontal scaling entirely. If an application stores user session state in local server memory, adding a second instance behind a load balancer either requires sticky sessions (which create uneven load distribution) or session replication (which adds network overhead and synchronization complexity). Test for this by running a horizontal scaling test without session affinity enabled and measuring error rates.
Horizontal vs. Vertical Scaling: Designing Tests That Prove Your Strategy Works
The choice between horizontal and vertical scaling isn’t theoretical — it’s an architectural constraint that your tests must validate. Use this decision framework:
| Criterion | Vertical Scaling Preferred | Horizontal Scaling Preferred |
|---|---|---|
| Application State | Shared in-memory session state; global locks | Stateless, externalized session storage |
| Deployment Model | Monolith on bare metal or single VM | Containerized microservices on orchestrator |
| Cost Profile | Predictable, capped growth; premium instance pricing acceptable | Variable demand; pay-per-instance elasticity required |
| Scaling Ceiling | Acceptable at single-machine hardware limits | Must exceed any single machine’s capacity |
Vertical Scaling Validation: Finding Your Single-Instance Ceiling
Design a stepped load test across progressively larger instance tiers while holding concurrency constant. Run a 30-minute test at 200 concurrent users on each tier: 2vCPU/4GB, 4vCPU/8GB, 8vCPU/16GB. Record p95 response time and throughput at each tier. If throughput scales from 850 req/s to 1,650 req/s to 2,800 req/s, vertical scaling is efficient for this workload. If throughput plateaus at 2,900 req/s on the 8vCPU tier with CPU at only 55%, the bottleneck is application-layer (Amdahl’s Law) and adding more CPU will not help. That plateau defines the vertical ceiling and signals the transition point to horizontal scaling evaluation.
Horizontal Scaling Validation: Testing Efficiency as You Add Instances
Horizontal scaling validation measures throughput and latency as instance count increases (1 → 2 → 4 → 8) while per-instance resources stay constant. The key metric is scaling efficiency:
Scaling Efficiency = (Actual Throughput Gain / Expected Linear Throughput Gain) × 100%
With 1 instance handling 1,000 req/s at p95=180ms, adding a second identical instance should yield approximately 1,950 req/s at p95=175ms (97.5% efficiency). If actual throughput is only 1,600 req/s (80% efficiency), investigate load balancer configuration, session affinity settings, or shared-state database contention. RadView’s platform supports distributed load generation from multiple injection points while monitoring each target instance independently — enabling precise per-instance efficiency measurement during horizontal scaling ramps.
Colm MacCárthaigh’s “constant work” pattern from the Amazon Builders’ Library [2] directly supports horizontal efficiency: systems designed to perform constant work at variable load distribute cleanly across horizontal instances because per-request overhead doesn’t change with fleet size.
Auto-Scaling Validation: Proving Your Cloud Scaling Rules Actually Work Under Load

NIST SP 800-145 defines Rapid Elasticity as capabilities that “can be elastically provisioned and released, in some cases automatically, to scale rapidly outward and inward commensurate with demand” [3]. Every cloud deployment assumes this works. Auto-scaling validation proves it works — or reveals where it doesn’t.
Designing the Auto-Scaling Validation Test: Load Profiles, Trigger Thresholds, and Timing Windows
Construct a four-phase load profile:
- Phase 1 — Baseline (10 min): 200 virtual users. Establish pre-scaling metrics: p95 latency, throughput, CPU utilization.
- Phase 2 — Trigger Ramp (5 min): Increase to 800 VU over 5 minutes, deliberately crossing the 70% CPU scale-out trigger.
- Phase 3 — Scaled Steady State (15 min): Hold 800 VU. Measure post-scale-out throughput efficiency, instance onboarding time, and SLA continuity.
- Phase 4 — Scale-In (10 min): Reduce to 100 VU. Observe scale-in behavior, connection draining, and instance termination sequence.
WebLOAD’s scenario editor enables precise phase-based load ramp construction with configurable ramp rates, plateau durations, and step-down profiles — making this four-phase design directly implementable. For practical guidance on building these kinds of phased scenarios, see this guide on creating realistic load testing scenarios.
What to Measure During Scale-Out: Latency Impact, Instance Onboarding, and SLA Continuity
Apply this validation checklist with specific pass/fail thresholds:
| Validation Criterion | Pass Threshold | Failure Indicator |
|---|---|---|
| Scale-out trigger latency | Policy fires within 90 seconds of CPU exceeding 70% | Trigger delay > 120 seconds |
| Instance warm-up + health check | New instance receives traffic within 120 seconds of launch | Instance not serving traffic after 180 seconds |
| p99 latency during provisioning window | Stays below 500ms | Exceeds 1,000ms during scale-out lag |
| Error rate during instance integration | < 0.5% | Connection reset or 503 errors during pool rebalancing |
| Scale-in connection draining | Active requests complete before instance termination | Dropped connections or 502 errors during scale-in |
| Cooldown period stability | No oscillation (repeated scale-out/scale-in) under sustained borderline load | Instance count fluctuates > 2 times in 10 minutes |
If auto-scaling triggers too slowly or new instances don’t onboard cleanly, the provisioning lag is exactly when MacCárthaigh’s retry-amplification spiral [2] begins — making auto-scaling validation a direct defense against the worst class of cloud-native production outage.
Scalability Testing Best Practices Checklist
- Baseline before scaling: Establish single-instance performance metrics (throughput, p95/p99 latency, error rate, resource utilization) before any scaling tests. Without a baseline, scaling efficiency calculations are meaningless.
- Test environment parity: Match production infrastructure as closely as possible — same instance types, same network topology, same database engine and version. A scalability test on a 2-core dev instance tells you nothing about a 16-core production server.
- Realistic data seeding: A database with 100 rows scales differently than one with 10 million rows. Seed test environments with production-representative data volumes, including index sizes and query plan complexity.
- Monitor the full stack: Capture client-side metrics (response time, error rate, throughput) and server-side metrics (CPU, memory, disk I/O, network, connection pool utilization, GC activity) simultaneously. Bottlenecks hide in the layer you’re not watching.
- Iterate, don’t just test: Scalability testing is a diagnostic loop — test, identify the constraint, remediate, re-test. A single pass tells you where the first bottleneck is. Three passes tell you whether your system actually scales.
- Embed in CI/CD: Run abbreviated scalability smoke tests (baseline + one scaling step) on every release candidate, following best practices for integrating performance testing in CI/CD pipelines. Reserve full multi-step scaling validation for milestone releases and infrastructure changes.
Frequently Asked Questions
How frequently should full scalability tests run versus abbreviated checks?
Full multi-step scalability validation (baseline → vertical ceiling → horizontal efficiency → auto-scaling validation) is warranted at three points: before major releases, after infrastructure changes (instance type migration, database engine upgrade, network topology change), and before anticipated traffic events. Abbreviated single-step scaling checks — baseline plus one scaling increment, measuring efficiency against the last known baseline — should run in CI/CD on every release candidate. The abbreviated version catches regressions in 15–20 minutes; the full suite takes 2–4 hours.
Is 100% scalability test coverage worth the investment?
Not always. Diminishing returns apply to test coverage just as they apply to scaling itself. Focus investment on the critical path: the request chains that carry 80%+ of production traffic and the components with the most complex scaling behavior (stateful services, database-dependent workflows, auto-scaling groups with custom policies). Testing every internal health-check endpoint for scaling behavior yields negligible insight at significant cost.
What’s the most commonly missed bottleneck in scalability testing?
Database connection pool saturation. Teams routinely monitor CPU and memory but neglect connection pool metrics. A pool of 20 connections serving 500 concurrent users produces queue times measured in seconds — and the cascade is self-amplifying because slow responses hold connections longer. Monitor active_connections, idle_connections, connection_wait_time, and connection_timeout_count as first-class scalability metrics.
Can auto-scaling tests be run in a staging environment, or do they require production infrastructure?
Staging environments can validate auto-scaling logic (trigger thresholds, cooldown behavior, health check integration) as long as the auto-scaling policies, instance types, and load balancer configurations mirror production. What staging cannot validate is the timing of real cloud provider instance provisioning — launch latency varies by instance type, availability zone saturation, and time of day. For latency-sensitive SLAs where a 30-second provisioning variance matters, validate trigger-to-traffic timing in a production-equivalent environment at least once per quarter.
How do you distinguish a scalability bottleneck from a load testing failure?
If performance degrades at a fixed infrastructure configuration as load increases, that’s a load/capacity issue — the system can’t handle the volume with the resources available. If performance fails to improve proportionally when you add resources under the same load, that’s a scalability bottleneck — something in the architecture (serialized code, shared state, connection pool limits) prevents the additional resources from translating into additional throughput. The diagnostic signal is the scaling efficiency metric: below 70% efficiency when adding instances points to an architectural constraint, not a capacity shortage.
How do you measure scalability?
Measure scalability by running a stepped load test that incrementally adds both workload and infrastructure, then calculating scaling efficiency: the ratio of actual throughput gain to expected linear throughput gain. A system scaling from 1,000 req/s on one instance to 1,950 req/s on two instances shows 97.5% efficiency; below 80% indicates a bottleneck preventing clean horizontal scaling.
Scalability testing differs from load testing because it measures the efficiency relationship between added resources and added throughput, not just behavior at fixed capacity. Track p95 latency, throughput, CPU utilization, connection pool saturation, and database query times across each scaling step. Watch for the inflection point where diminishing returns transition into degradation — typically visible when throughput plateaus while resource utilization remains below ceiling, indicating application-layer serialization or shared-state contention rather than infrastructure exhaustion.
How do you test scalability?
Test scalability by designing a stepped workload that increases concurrent users in defined increments (e.g., 500, 1000, 2500, 5000) while recording throughput, response time percentiles, and resource utilization at each step. Compare horizontal scaling (adding instances) against vertical scaling (larger instances) to determine which strategy your architecture supports efficiently.
A rigorous scalability test combines three scenarios: vertical scaling validation to find the single-instance ceiling, horizontal scaling validation to measure per-instance efficiency as you add nodes, and auto-scaling validation to verify that cloud scaling policies trigger correctly under real load patterns. Monitor for database connection pool saturation, thread contention, and stateful session handling — these are the scalability killers that only appear under multi-instance, multi-concurrency load and are invisible at fixed capacity.
How do you test auto-scaling performance?
Test auto-scaling by applying a controlled traffic surge that crosses your configured scaling trigger (e.g., 70% CPU or request rate threshold), then measure three things: time from trigger breach to new instance readiness, latency impact during the scale-out transition, and whether SLA thresholds remain intact through the scaling event. A well-configured auto-scaler provisions new capacity within 60–90 seconds with minimal user-visible latency spike.
Design the load profile to ramp from below trigger threshold to 150% of steady-state capacity within 30–60 seconds, then hold for at least 5 minutes to verify stabilization. Measure the 'scaling gap' — the window between trigger firing and new instances accepting traffic — because this is where cascading retry storms form if the gap exceeds client timeouts. Validate scale-in behavior too: premature scale-in during brief traffic dips wastes capacity on repeated provisioning cycles.
References and Authoritative Sources
- Perry, A. & Luebbe, M. (2017). Chapter 17 – Testing for Reliability. In B. Beyer, C. Jones, J. Petoff, & N.R. Murphy (Eds.), Site Reliability Engineering: How Google Runs Production Systems. O’Reilly Media / Google, Inc. Retrieved from https://sre.google/sre-book/testing-reliability/
- MacCárthaigh, C. (N.D.). Reliability, constant work, and a good cup of coffee. Amazon Builders’ Library. Retrieved from https://aws.amazon.com/builders-library/reliability-and-constant-work/
- Mell, P. & Grance, T. (2011). The NIST Definition of Cloud Computing (NIST Special Publication 800-145). National Institute of Standards and Technology. Retrieved from https://nvlpubs.nist.gov/nistpubs/Legacy/SP/nistspecialpublication800-145.pdf
- GitLab. (N.D.). App DB Connection Pool Saturation Runbook. GitLab Runbooks. Retrieved from https://gitlab.com/gitlab-com/runbooks/-/blob/v2.244.0/docs/registry/app-db-conn-pool-saturation.md


