Server-side performance
Finding the problem and the root cause

No server-side installation
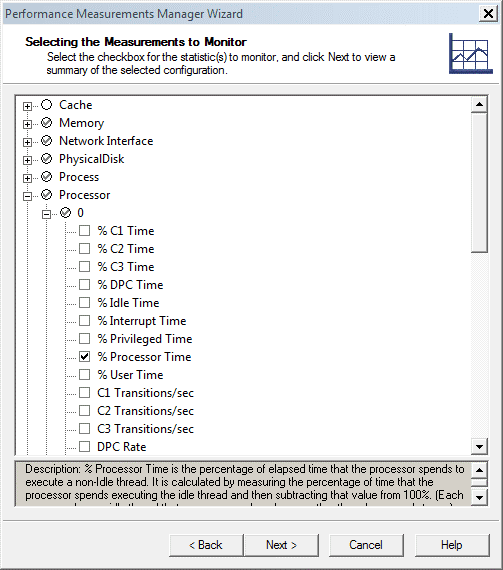
WebLOAD’s monitoring is agentless, requiring no server-side installation. It can be configured to handle secure servers located behind a firewall, supports the import of server-side statistics from 3rd party monitoring tools, as well as the export of monitoring data to external systems.
Built-in server monitoring
Root-cause Analysis using APM and Monitoring tools
WebLOAD’s built-in integration with application performance management (APM) tools helps you take root cause analysis one step further. Once you identify a performance issue using WebLOAD you can switch to your APM tool and correlate the WebLOAD transaction to the server-side event. You can accurately identify events behind bottlenecks and quickly resolve issues.
WebLOAD currently provides built-in integration with Dynatrace, AppDynamics, New Relic and Nagios.
