Reliability testing is a software quality assurance discipline that verifies a system performs its intended functions consistently, without failure, over a specified period and under defined operating conditions.
That definition sounds straightforward until you consider what happens when teams skip it. In July 2024, a flawed CrowdStrike software update cascaded across Microsoft Windows platforms worldwide. Delta Air Lines absorbed the worst impact among U.S. carriers, thousands of flight cancellations and estimated losses exceeding $500 million [1]. The initial failure was bad; the prolonged recovery time made it catastrophic.
Delta’s case isn’t an anomaly. A landmark NIST study estimated the national annual cost of inadequate software testing infrastructure at $22.2 to $59.5 billion, with over half borne by software users through error avoidance and mitigation [2]. Most organizations still default to counting defects rather than systematically forecasting field reliability, a gap that compounds with every release cycle.
If you’ve been frustrated by reliability guidance that stops at definitions and never reaches implementation, this guide closes that gap. You’ll get the exact metrics to track (with formulas and worked examples), a comparison of test types, a step-by-step planning framework, standards references you can act on, and a walkthrough of how continuous load testing validates system reliability across every release.
- The One-Sentence Definition (And Why It’s More Nuanced Than You Think)
- Key Reliability Testing Metrics: MTBF, MTTR, Availability, and Failure Rate Explained
- Types of Reliability Tests: A Practical Map for Engineering Teams
- IEEE and ISTQB Reliability Standards: The Frameworks Behind the Practice
- How to Plan a Reliability Test: A Step-by-Step Framework
- Validating Reliability with Continuous Load Testing Across Releases
- Frequently Asked Questions
- References and Authoritative Sources
The One-Sentence Definition (And Why It’s More Nuanced Than You Think)
The definition above, consistent performance, without failure, over time, under defined conditions, carries three load-bearing clauses that determine everything about how you design a reliability test program.
“Intended functions” scopes what you measure. A payment gateway’s reliability is measured against transaction completion and data integrity, not whether it renders a pixel-perfect UI. Your reliability criteria must map to the functional contract the system promises its users.
“Specified period” determines test duration. A system that works flawlessly for 20 minutes but leaks memory until it crashes at hour 72 has a reliability problem that short-duration testing will never surface. ISO/IEC 25010, the international standard defining software quality characteristics, lists reliability alongside performance efficiency, security, and maintainability as a core quality attribute, with sub-characteristics including maturity, availability, fault tolerance, and recoverability [3]. Each sub-characteristic implies a different time horizon for testing.
“Defined operating conditions” means your test environment and load profile must reflect production reality. Testing under synthetic, low-traffic conditions tells you almost nothing about how the system behaves when 10,000 concurrent users hit the checkout flow during a flash sale.
Reliability testing is not a single test run. It’s not synonymous with performance testing (which focuses on speed and throughput under load). And it’s not a final-phase gate you bolt on before release.
Reliability vs. Performance vs. Functional Testing: Where the Lines Actually Fall
These testing disciplines overlap enough to cause confusion but differ in objective, duration, and pass/fail criteria. NIST’s research found that organizations which “simply count the number of defects” rather than forecast field reliability lack the measurement maturity to distinguish between these disciplines effectively [2]. For a deeper dive into how these disciplines relate, see our complete guide to performance testing.
| Dimension | Functional Testing | Performance Testing | Stress Testing | Reliability/Soak Testing |
|---|---|---|---|---|
| Primary Question | Does it work correctly? | How fast is it under load? | At what point does it break? | Does it keep working over time? |
| Typical Duration | Minutes per test case | 15–60 minutes | 30 min–2 hours (ramp to failure) | 24–72+ hours |
| Load Profile | Single user or small set | Expected peak concurrent users | Beyond-capacity load, escalating | Sustained steady-state load |
| Pass/Fail Trigger | Incorrect output or error | p95 latency > threshold; throughput below target | System crash, data loss, unrecoverable error | Performance drift, memory leak, gradual degradation |
Think of it this way: functional testing checks that your car starts. Performance testing checks how fast it accelerates. Stress testing finds out what happens when you redline the engine. Reliability testing checks that it still starts, and accelerates consistently, after 50,000 miles in all weather.
When Reliability Testing Happens in the Development Lifecycle
Reliability testing is not a phase. It’s a continuous practice embedded across the SDLC. As IBM notes: “Today, software testing is deeply embedded in modern development practices, driven by Agile transformation, DevOps, and continuous integration/continuous delivery (CI/CD) pipelines. Testing is no longer a final step before release, it begins at the design planning phase and continues after deployment” [1].
NIST’s research further confirms the economic case: late-stage bug detection costs up to 30x more than early detection [2]. Waiting until staging to run your first reliability test means you’re paying premium prices for defects that could have been caught at integration.
Here’s the practical mapping:
- Design & Development: Feature reliability tests and unit-level regression checks validate individual components under repeated invocations. Embed these in CI pipelines so every merge request triggers automated reliability regression.
- Pre-Release / Staging: Load testing, soak testing, and stress testing validate system-level reliability under production-representative conditions. This is where you measure MTBF against your quantified targets.
- Post-Release / Production: Recovery testing and fault injection (chaos testing) verify that your system degrades gracefully and recovers within your RTO when real-world failures occur. Shift-right reliability testing catches the failure modes that only manifest under live traffic patterns, an approach explored in detail in our guide to shift-left and shift-right in performance engineering.
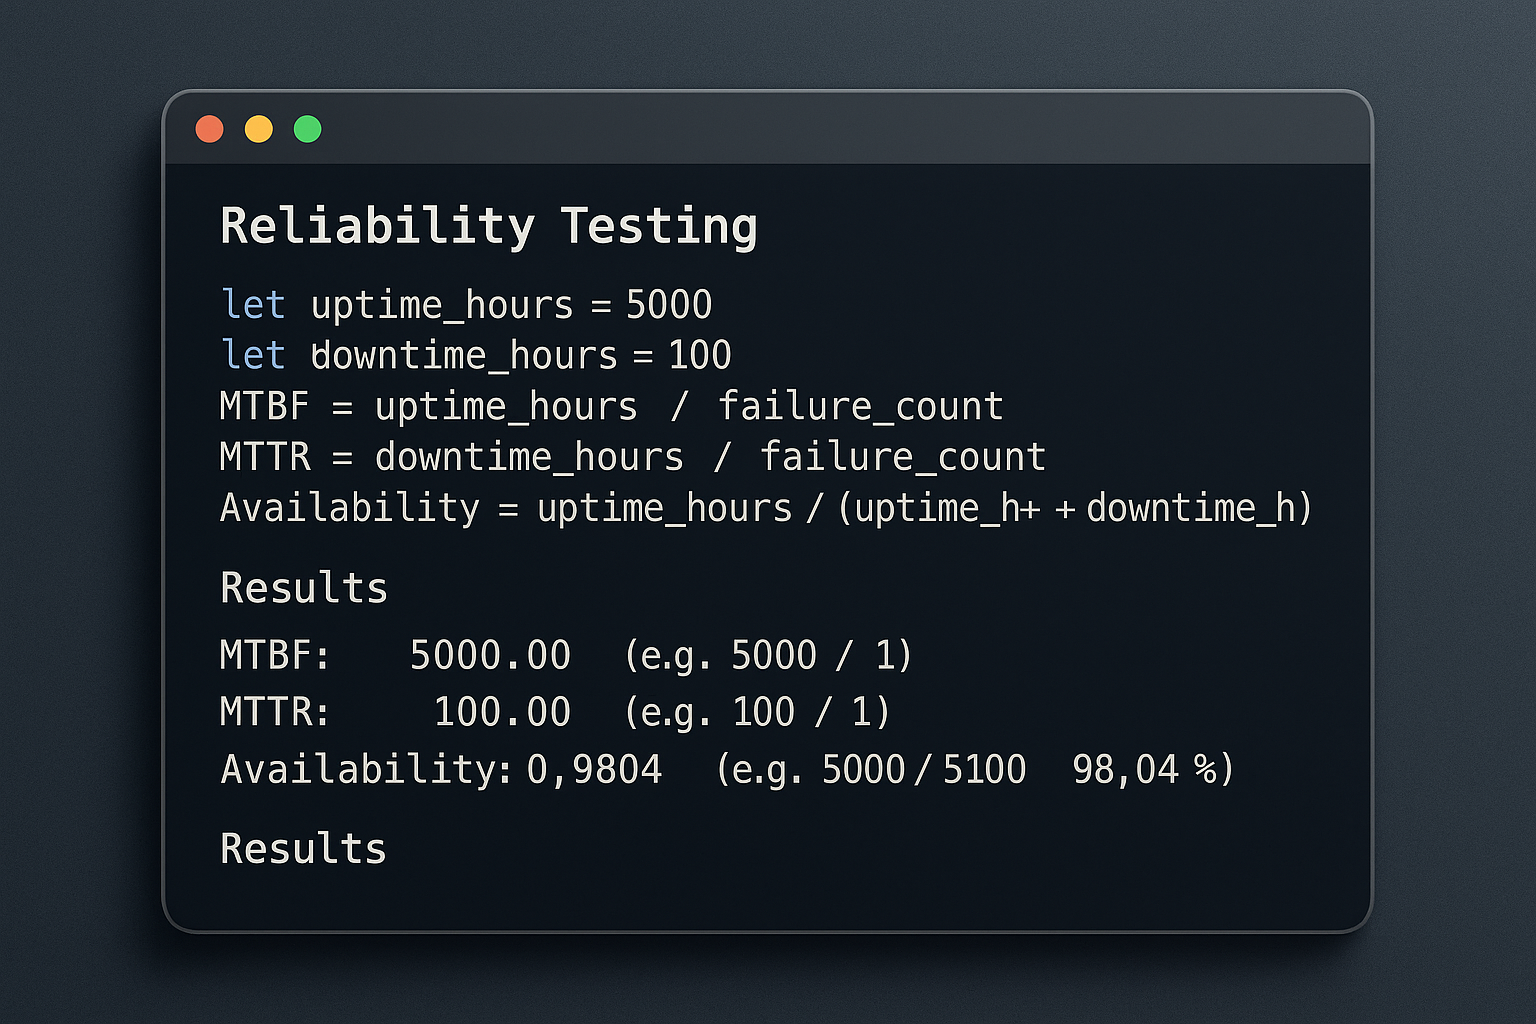
Key Reliability Testing Metrics: MTBF, MTTR, Availability, and Failure Rate Explained

This is where most reliability guidance falls short. Competitors define these metrics in a sentence and move on. NIST found that “few organizations engage in advanced testing techniques such as forecasting field reliability based on test data and calculating defect density to benchmark the quality of their product against others” [2]. The section below gives you the formulas, worked examples, and interpretation guidance to be one of those organizations.
MTBF and MTTF: The Difference That Trips Up Most Teams
MTBF (Mean Time Between Failures) applies to repairable systems, which includes virtually all enterprise software, since you patch, restart, and redeploy rather than discard. It measures the average uptime between consecutive failure events.
Formula: MTBF = Total Operating Time ÷ Number of Failures
Worked example: Your API gateway ran for 1,000 hours over the past quarter and experienced 5 unplanned outages. MTBF = 1,000 ÷ 5 = 200 hours between failures. If your reliability target was MTBF ≥ 300 hours, you’ve failed, and you now have a specific, numeric gap to investigate.

NIST’s Computer Security Resource Center defines MTBF as the average time between system failures during operation [4]. It’s the single most commonly referenced reliability metric in SLA negotiations and capacity planning.
MTTF (Mean Time To Failure) applies to non-repairable components, hardware modules that get replaced, not repaired. For software, MTTF is occasionally used for components that are deprecated and replaced rather than patched.
Formula: MTTF = Total Operating Time ÷ Number of Units Tested
NIST’s Planning Report confirms that MTTF is listed among key metrics for measuring software reliability within the ISO 9126 quality framework [2]. For most engineering teams working on web applications, APIs, and microservices, MTBF is your operative metric.
MTTR: The Recovery Metric Your SLA Probably Already Requires
MTTR (Mean Time To Repair/Recover) measures how quickly your team restores service after a failure.
Formula: MTTR = Total Repair Time ÷ Number of Repair Events
Worked example: Your system experienced 3 incidents this month. Total downtime across all three: 90 minutes. MTTR = 90 ÷ 3 = 30 minutes per incident.
A critical distinction most teams miss: repair time (time to identify and fix the root cause) and recovery time (time to restore service to users) are not the same. You can restore service via failover in 2 minutes while the root-cause fix takes 4 hours. Your SLA cares about the recovery time; your engineering backlog cares about the repair time. Track both.
The Delta/CrowdStrike incident illustrates the stakes: the initial software failure triggered the outage, but the prolonged recovery time, measured in days, not minutes, drove the $500M+ business impact [1]. Reducing MTTR is just as strategically important as increasing MTBF. A short MTTR means fast recovery even when failures do occur.
Availability Percentage and Failure Rate: The Business-Language Translation
Availability ties MTBF and MTTR together into the metric that business stakeholders actually understand. For a broader look at the performance metrics that matter in performance engineering, including response time and throughput, see our dedicated guide.
Formula: Availability (%) = (MTBF ÷ (MTBF + MTTR)) × 100
Using the examples above: Availability = (200 ÷ (200 + 0.5)) × 100 = 99.75%. That sounds impressive until you translate it to downtime.
The “Nines” Table:
| Availability | Annual Downtime | Common SLA Tier |
|---|---|---|
| 99% (“two nines”) | 87.6 hours (3.65 days) | Basic internal tools |
| 99.9% (“three nines”) | 8.76 hours | Standard SaaS |
| 99.99% (“four nines”) | 52.6 minutes | Financial services, healthcare |
| 99.999% (“five nines”) | 5.26 minutes | Critical infrastructure, emergency systems |
Failure Rate is simply the inverse of MTBF:
Formula: Failure Rate (λ) = 1 ÷ MTBF
Industry guidance targets a failure rate below 1% for high-quality software. NIST’s research found that most organizations never calculate failure rate at all, they count bugs instead [2]. Teams that track failure rate as a quantified metric have a measurable advantage in reliability forecasting because they can plot trends across releases and detect reliability regressions before users do.
ISO/IEC 25010 positions availability as one of four reliability sub-characteristics alongside maturity, fault tolerance, and recoverability [3], reinforcing that availability alone doesn’t capture the full reliability picture.
Types of Reliability Tests: A Practical Map for Engineering Teams

The ISTQB’s glossary classifies reliability testing as a quality characteristic test type requiring both functional and non-functional coverage, meaning there’s no single “reliability test.” Instead, you select from a taxonomy of test types based on risk, lifecycle stage, and the specific reliability sub-characteristic you’re validating.
Feature Reliability Testing and Regression Testing: Your First Line of Defense
Feature reliability testing validates whether individual capabilities perform correctly and consistently under normal conditions over repeated invocations, not just “does it work once?” but “does it keep working after 10,000 iterations?”
Regression testing for reliability adds: “Did this release break what was already working?” For a comprehensive look at regression testing strategies, including what to test and when, see our guide on understanding regression testing.
Scenario: A payment checkout feature passes all functional tests on release day. Three days later, intermittent failures surface under concurrent load, a race condition introduced in the same release but invisible in single-user functional tests. A reliability-focused regression suite that replays checkout transactions under 200 concurrent sessions for 4 hours after every merge would have caught this before deployment.
Embedding regression reliability checks in CI/CD pipelines is the mechanism that makes this practical at scale. Without automation, teams fall back to reactive defect counting, which NIST’s data shows is the norm, not the exception [2].
Load, Stress, and Soak Testing: The Sustained-Demand Trio
These three test types are frequently confused but target distinct failure signatures.
| Dimension | Load Testing | Stress Testing | Soak/Endurance Testing |
|---|---|---|---|
| Objective | Validate behavior under expected peak traffic | Find the breaking point | Surface time-dependent degradation |
| Duration | 15–60 minutes | 30 min–2 hours | 24–72+ hours |
| Load Profile | Realistic peak concurrent users | Escalating beyond capacity | Sustained steady-state (typically 60–80% of peak) |
| Failure Signature Detected | Throughput drops, latency spikes at target load | System crash, unrecoverable errors, data corruption | Memory leaks, connection pool exhaustion, p99 drift |
| Primary Metric | p95 response time, throughput (req/s) | Maximum capacity before failure | p99 latency trend over time, resource utilization slope |
Load test scenario: 2,000 concurrent virtual users hitting the product catalog API for 45 minutes. Pass criteria: p95 response time < 800ms, error rate < 0.5%.
Stress test scenario: Ramp from 2,000 to 10,000 virtual users over 90 minutes. Goal: identify at what concurrency level error rate exceeds 5% and whether the system recovers when load subsides.
Soak test scenario: 500 concurrent virtual users executing a mixed workload against a payment processing API for 48 hours. Watch for p99 response time drift above 1,500ms, JVM heap growth that doesn’t flatten, or database connection pool utilization climbing past 85%. Our endurance testing guide covers soak test design and execution in greater depth.
WebLOAD supports executing all three test types with parameterized scripting and real-time analytics, enabling teams to run sustained-demand scenarios across cloud and on-premises environments without maintaining separate tool chains for each test type.
Recovery Testing and Fault Injection: Proving Your System Bounces Back
Recovery testing directly measures MTTR in practice. You intentionally introduce a failure, process kill, network partition, dependency timeout, and measure how quickly the system detects, isolates, and restores service.
Fault injection extends this by injecting specific failure conditions to verify graceful degradation:
- Scenario 1: Inject a TCP connection timeout at the database layer during a peak-load test. Pass criteria: the application returns a degraded-but-functional response (cached results or a user-friendly error) within 3 seconds rather than hanging indefinitely. RTO target: < 15 minutes to full database connectivity restoration.
- Scenario 2: Kill 2 of 5 application server instances during a soak test. Pass criteria: the load balancer redistributes traffic within 30 seconds with no user-visible 5xx errors, and auto-scaling provisions replacement instances within 5 minutes.
The industry-recognized chaos engineering methodology follows a structured loop: hypothesis → baseline measurement → fault injection → monitoring → documentation → remediation. For a hands-on walkthrough of this methodology with real-world examples, see our guide on mastering chaos testing. The Delta/CrowdStrike incident was fundamentally a recovery testing gap, the initial failure was a bad update, but the multi-day recovery timeline exposed the absence of validated recovery procedures [1].
IEEE and ISTQB Reliability Standards: The Frameworks Behind the Practice
Standards exist to ensure your reliability program covers the right ground, not just the ground you happened to think of. Here’s what the major frameworks actually require.
What These Standards Actually Require You to Test
ISO/IEC 25010 (SQuaRE Quality Model) [3] defines four reliability sub-characteristics. A complete reliability test program must cover all four:
- Maturity: How frequently does the system fail under normal usage? Measure via MTBF tracking across releases.
- Availability: What percentage of time is the system operational and accessible? Validate with soak tests and production uptime monitoring.
- Fault Tolerance: Does the system continue operating (possibly in degraded mode) when components fail? Validate with fault injection and chaos testing.
- Recoverability: How quickly and completely does it restore state after failure? Validate with recovery testing against RTO/RPO targets.
IEEE 1633 (Recommended Practice for Software Reliability) recommends that reliability goals be quantified numerically, as MTBF targets or failure-rate thresholds, before testing begins. Most teams skip this step, which means they have no objective pass/fail criterion. Without a target, every test “passes” by default.
ISTQB Foundation Level Syllabus classifies reliability testing as a quality characteristic test type, requiring both functional verification (does the feature work correctly each time?) and non-functional verification (does it continue working under load, over time, after failure?). This dual mandate is why reliability testing spans multiple test types rather than being a single activity.
How to Plan a Reliability Test: A Step-by-Step Framework
Here’s the planning process, structured so you can use it as a checklist for your next reliability initiative.
- Quantify reliability goals before writing a single test script: Set a numeric MTBF target (e.g., MTBF ≥ 500 hours under peak load), an availability threshold (e.g., 99.95%), and a failure-rate ceiling (e.g., λ < 0.002 failures/hour). IEEE 1633 explicitly recommends this step, without it, you have no objective pass/fail criterion.
- Identify the system under test and map its operational profile: Catalog the application’s primary user journeys, API endpoints, and background processes. Weight them by actual production usage frequency (from analytics data or APM logs), not by engineering team assumptions.
- Select test types based on risk and lifecycle stage: Map each reliability sub-characteristic (maturity, availability, fault tolerance, recoverability) to a specific test type. Not every release needs every test type, prioritize by recent change impact and historical failure patterns.
- Design a production-representative test environment: Use the same infrastructure topology, database sizes, third-party service integrations, and network latency profiles as production. A test that passes in a single-node dev environment proves nothing about distributed production behavior.
- Define success and failure criteria before executing: Document exact thresholds: p95 response time < 600ms, error rate < 0.3%, memory utilization slope < 2% per hour over a 48-hour soak. Ambiguous criteria ("acceptable performance") invite post-hoc rationalization.
- Execute, instrument, and collect metrics in real time: Monitor CPU, memory, network I/O, garbage collection pauses, database connection pool utilization, and application-level metrics (throughput, latency percentiles, error rates) throughout the test run. RadView’s WebLOAD platform captures these metrics in real time during load test execution, with built-in correlation between virtual user actions and server-side resource consumption.
- Analyze results against your pre-defined criteria and act on findings: Compare observed MTBF, MTTR, availability, and failure rate against your Step 1 targets. For every failed criterion, perform root-cause analysis, implement a fix, and re-test. NIST’s research shows that organizations with this kind of closed-loop reliability measurement achieve demonstrably better software quality outcomes [2].
Defining Your Operational Profile: Test What Users Actually Do
An operational profile is a statistical model of real user behavior, which functions users invoke, how frequently, in what sequence, and under what concurrency. Testing against an accurate operational profile means your reliability results reflect actual production failure probability, not idealized scenarios.
To build one:
- Extract production usage data from APM tools, CDN logs, or application analytics. Identify the top 20 user journeys by frequency.
- Normalize by invocation frequency: If “search” accounts for 40% of all API calls and “admin settings” accounts for 0.3%, your test workload should reflect that ratio.
- Weight test execution proportionally: Allocate virtual user scenarios in your load test tool to match the operational profile. This ensures high-frequency paths receive the most rigorous reliability coverage, the same principle behind Accelerated Life Testing (ALT) for software.
Testing against an accurate operational profile is the difference between discovering a memory leak in a rarely-used admin panel (low impact) and discovering it in your checkout flow (high impact, high frequency, high revenue risk).
Validating Reliability with Continuous Load Testing Across Releases

Reliability isn’t a one-time certification, it’s a property that degrades with every code change unless actively validated. Continuous load testing embeds reliability checks into your CI/CD pipeline so that every release is measured against your quantified reliability targets before it reaches production.
The implementation pattern:
- Trigger: Every merge to the main branch or release candidate tag initiates an automated load test suite.
- Execution: A pre-configured soak test (e.g., 4 hours at 70% of peak load) runs against a staging environment that mirrors production topology.
- Gate criteria: The pipeline fails the build if p95 response time exceeds the threshold, error rate climbs above the ceiling, or memory utilization slope indicates a leak.
- Trend tracking: Store results per release so you can plot MTBF and failure rate trends over time, catching gradual reliability erosion that any single test run would miss.
WebLOAD enables this pattern through its scripting engine and API-driven test execution, allowing teams to integrate sustained-demand reliability validation into CI/CD pipelines including Jenkins, GitLab CI, or Azure DevOps without manual intervention per release.
The ROI case is straightforward: a 4-hour automated soak test that catches a memory leak before deployment costs a fraction of a production incident that takes down your service for 8 hours, which, depending on your availability tier, could blow through your quarterly SLA budget in a single afternoon.
Frequently Asked Questions
Q: Is it worth running soak tests for every release, or only major ones?
Run abbreviated soak tests (4–8 hours) for every release that touches backend logic, data layer, or infrastructure configuration. Reserve full 48–72 hour soak tests for major releases and quarterly reliability audits. The abbreviated version catches 80%+ of memory leaks and connection pool exhaustion issues at a fraction of the cost.
Q: What’s the minimum MTBF target I should set if I have no historical baseline?
Start by measuring your current MTBF from production incident logs over the past 90 days. Set your initial target at 1.5× the current value, aggressive enough to drive improvement, realistic enough to be achievable within one or two release cycles. Avoid copying another organization’s MTBF target; your architecture, traffic patterns, and risk tolerance are different.
Q: Is 100% reliability test coverage worth the investment?
Not always. Full coverage of every feature, path, and failure mode is theoretically ideal but practically impossible within release timelines. Focus on coverage weighted by operational profile frequency and business impact. A checkout flow handling 10,000 daily transactions deserves exhaustive reliability testing. A rarely-used internal report generator does not. Diminishing returns set in quickly past 80% weighted coverage.
Q: How do I distinguish between a genuine reliability regression and normal test variance?
Establish a statistical baseline by running the same test suite 3–5 times on a known-stable build and calculating the standard deviation of key metrics (p95 latency, error rate, throughput). Flag a regression only when a metric deviates by more than 2 standard deviations from the baseline mean. Single-run comparisons produce false positives roughly 30% of the time in environments with shared infrastructure or variable background load.
Q: Should MTTR targets be set by the engineering team or negotiated with business stakeholders?
Both. Engineering sets the technically achievable floor based on architecture constraints (failover time, auto-scaling speed, deployment rollback duration). Business stakeholders set the commercially required ceiling based on SLA commitments and revenue-at-risk calculations. Your MTTR target lives at the intersection, and if engineering can’t meet the business requirement, that’s an architecture investment conversation, not a testing conversation.
Editorial note: Metric benchmarks referenced in this guide (e.g., sub-1% failure rate targets, availability tiers) are industry guidelines, not universal guarantees. Testing outcomes vary by architecture, environment, and workload profile. The NIST economic impact figures cited are from a 2002 publication (Planning Report 02-3) and are referenced as foundational research; current-year cost estimates may differ significantly.
References and Authoritative Sources
- IBM. (N.D.). What is Software Testing? IBM Think. Retrieved from https://www.ibm.com/think/topics/software-testing
- RTI for the National Institute of Standards and Technology. (2002). The Economic Impacts of Inadequate Infrastructure for Software Testing (NIST Planning Report 02-3). Retrieved from https://www.nist.gov/system/files/documents/director/planning/report02-3.pdf
- International Organization for Standardization. (2011). ISO/IEC 25010:2011. Systems and Software Quality Requirements and Evaluation (SQuaRE): System and Software Quality Models. Retrieved from https://www.iso.org/standard/74348.html
- National Institute of Standards and Technology. (N.D.). Mean Time Between Failures (MTBF). NIST Computer Security Resource Center Glossary. Retrieved from https://csrc.nist.gov/glossary/term/mean_time_between_failures


