P99 latency is the maximum response time experienced by the slowest 1% of requests in a given measurement window, and it tells you exactly how bad your worst-case user experience really is.
Your average response time might read 200ms, and every dashboard light glows green. Then a customer on a slow Tuesday afternoon hits the checkout button and waits eight seconds. That customer is real. They’re in your p99. And your average never warned you they existed.
The core problem is structural: averages actively mask tail-end slowdowns. A mean of 590ms can hide a reality where most users see 200ms and a meaningful minority endures 8,000ms. This article breaks down why that happens, proves it with arithmetic, gives you a comparison table of p50 through p99.9 with concrete SLO thresholds, walks through how to measure p99 accurately in a load test, quantifies what a high p99 costs in SLA terms and user trust, and shows you how to set up automated threshold alerts that catch regressions before they reach production. By the end, you’ll have an actionable playbook for catching p99 problems where they belong: in your test environment, not your incident channel.
- The One-Sentence Definition (and Why It Changes Everything)
- Why Your Average Response Time Is Lying to You
- P50 vs. P95 vs. P99 vs. P99.9: A Practical Comparison (With a Decision Table)
- How to Measure P99 Latency in Load Testing
- What High P99 Latency Actually Does to Your Users (and Your SLA)
- Frequently Asked Questions
- References
The One-Sentence Definition (and Why It Changes Everything)
P99 latency is the response-time threshold below which 99% of all measured requests complete. That means 1 in every 100 users hits a slowdown at or above that number.
Think of percentiles like runners crossing a finish line. P50 is where the middle-of-the-pack runner finishes. P95 is the point where 95 runners have crossed. P99 is the line that 99 out of 100 runners have cleared, and the single runner still on the course is the one whose experience your average never captured.
This isn’t a niche academic concern. Jeffrey Dean and Luiz André Barroso documented in their seminal Google Research paper The Tail at Scale that “temporary high latency episodes which are unimportant in moderate size systems may come to dominate overall service performance at large scale” [1]. Rob Ewaschuk, writing in the Google SRE Book: Monitoring Distributed Systems, identified latency as one of the Four Golden Signals for monitoring any user-facing system, and explicitly argued that tail percentiles, not averages, are the measurement that matters [2].
P99 is the metric that tells you whether your system is reliable for virtually everyone, or merely reliable for most people while silently failing the rest.
Why Your Average Response Time Is Lying to You
Average latency isn’t imprecise. It’s actively deceptive. The arithmetic mean of a right-skewed distribution, which is what every latency distribution is, floats in a zone that describes almost nobody’s actual experience: too high for the majority and far too low for the suffering minority.
Rob Ewaschuk put it directly: “If you run a web service with an average latency of 100 ms at 1,000 requests per second, 1% of requests might easily take 5 seconds. If your users depend on several such web services to render their page, the 99th percentile of one backend can easily become the median response of your frontend” [2]. That sentence should end the debate about whether averages are good enough for latency monitoring.
Latency distributions are structurally non-normal because response times have a hard floor (you can’t respond faster than zero) but no ceiling, garbage collection pauses, lock contention, cold caches, and network retries all push the right tail outward. Research from UC San Diego on tail latency in distributed systems confirms that this right-skewed shape is inherent to networked systems, not an anomaly to be averaged away.
The Math Proof: How a 5% Tail Inflates Your Mean by 3x
Consider the scenario from the introduction. You have a pool of requests where 95% complete in 200ms and 5% take 8,000ms.
Arithmetic mean: (0.95 × 200) + (0.05 × 8,000) = 190 + 400 = 590ms.
The median (p50) is 200ms. The p99 is 8,000ms. The mean, 590ms, sits in a gap that represents neither the typical experience (200ms) nor the worst case (8,000ms). It’s a fictional number. If you set an alert threshold at 600ms based on this average, you’d never page, and 5% of your users would experience 40x the response time you think they’re seeing.
A second example makes the pattern undeniable. Take 1,000 requests: 990 at 100ms and 10 at 10,000ms.
Arithmetic mean: (990 × 100 + 10 × 10,000) / 1,000 = (99,000 + 100,000) / 1,000 = 199ms.
The p50 is still 100ms. The p99 is 10,000ms. The mean (199ms) is barely 2x the median, while the p99 is 100x. If you’re paging on average latency, you’re paging on a fiction, one that obscures a 10-second experience for your worst-served users.
Dean and Barroso observed precisely this masking effect at Google scale, noting that as system complexity increases, these tail events stop being rare edge cases and start dominating overall perceived performance [1].
Visualizing the Distribution: What a Latency Histogram Actually Shows

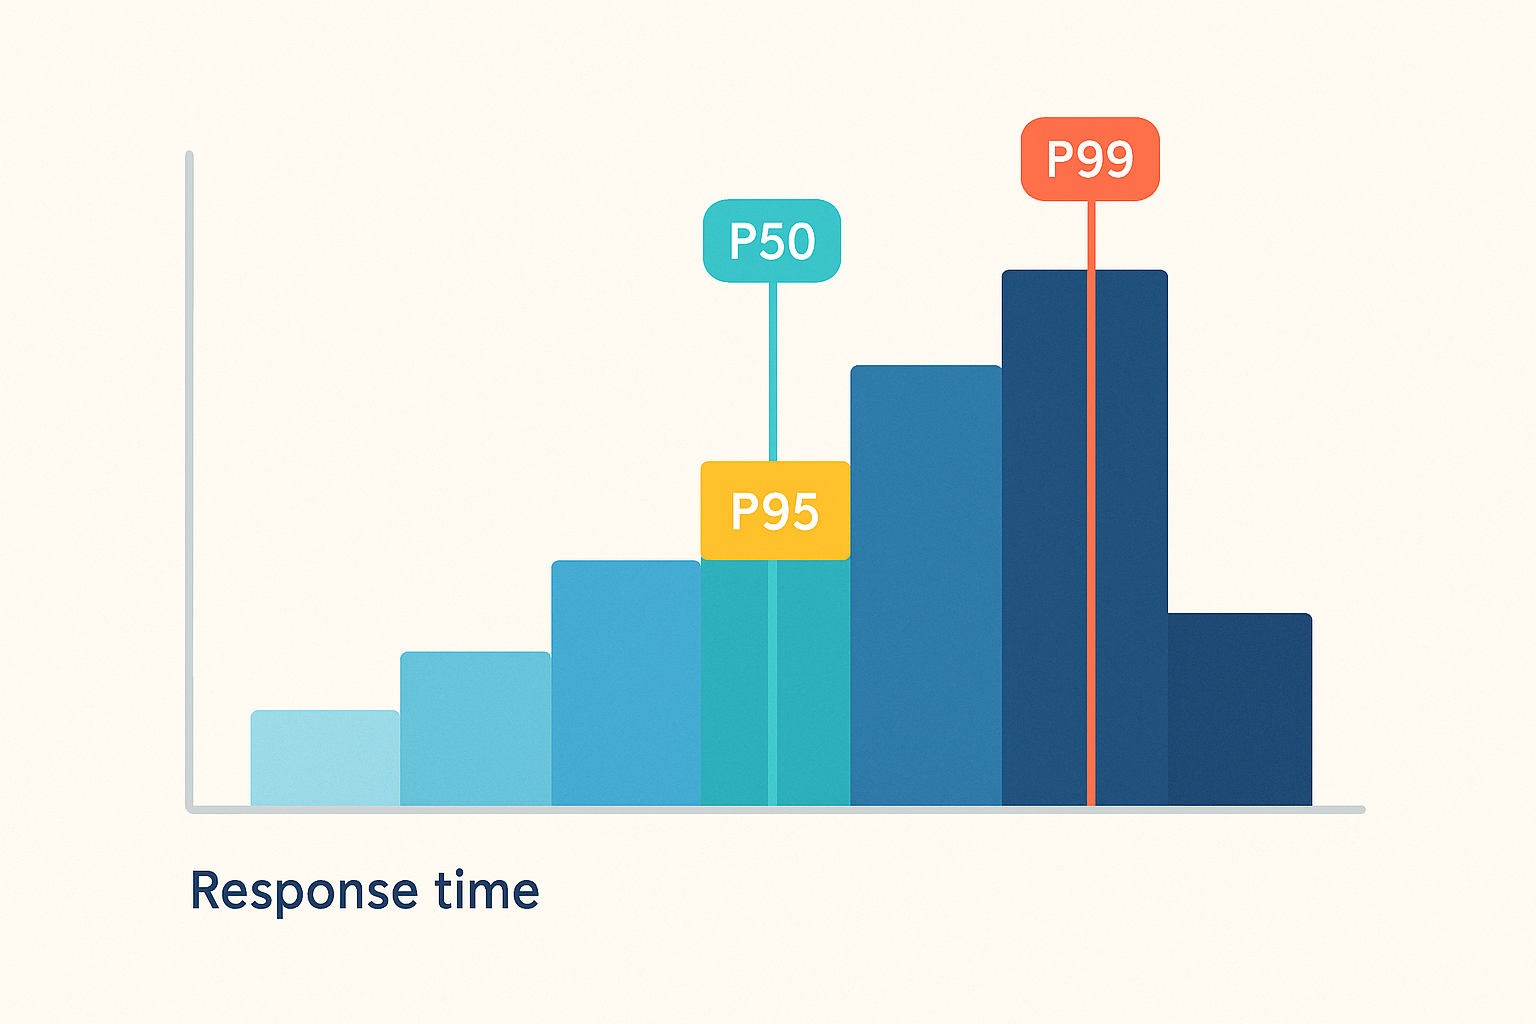
Picture a histogram where the x-axis represents response-time buckets (0–200ms, 200–500ms, 500–2,000ms, 2,000ms+) and the y-axis shows request count. For the first scenario above, you’d see a massive bar in the 0–200ms bucket containing 95% of all requests. A dramatically shorter bar appears in the 2,000ms+ bucket representing the 5% tail. The buckets in between are nearly empty.
P50 sits in that first tall bar. P95 might land at the upper edge of 200–500ms. P99 is way out in the 2,000ms+ bucket, visually obvious as a distinct spike, yet completely invisible if you only look at the mean.
This is exactly the chart your load testing tool should surface during every test run. The Google SRE Workbook recommends histograms over averages for latency SLI measurement precisely because they expose the shape of the distribution [3]. When you run a test and see that rightward spike forming in real time, you know immediately that a tail problem is developing, information an average trend line would hide until post-mortem.
P50 vs. P95 vs. P99 vs. P99.9: A Practical Comparison (With a Decision Table)
| Percentile | What It Measures | What a High Value Signals | Best Used For | Typical Web-App Threshold |
|---|---|---|---|---|
| P50 (Median) | The response time that 50% of requests fall below | Baseline system health degradation; infrastructure-level problems | Health dashboards, capacity planning baselines | < 200ms |
| P95 | The threshold below which 95% of requests complete | Moderate tail issues affecting 1 in 20 users; emerging bottlenecks | SLA negotiation with business stakeholders; external customer commitments | < 500ms |
| P99 | The threshold below which 99% of requests complete | Significant tail latency affecting 1 in 100 users; GC pauses, lock contention, slow queries | Internal engineering SLOs; CI/CD performance gates; incident detection | < 2,000ms |
| P99.9 | The threshold below which 99.9% of requests complete | Extreme outliers affecting 1 in 1,000 users; cold starts, retry storms, cascading timeouts | Payment flows, authentication, safety-critical paths | < 5,000ms |
The Google SRE Workbook provides the institutional template for this approach: “In order to capture both the typical user experience and the long tail, we also recommend using multiple grades of SLOs… 90% of requests are faster than 100 ms, and 99% of requests are faster than 400 ms” [3]. The key insight is that a single percentile threshold cannot capture both normal and tail-end behavior, you need at least two.
When P99 Is Not Enough: Introducing P99.9 for Critical Paths

Tail latency compounds in fan-out architectures. When a single user-facing request triggers dozens of downstream service calls, the p99.9 of any individual service can become the effective p50 of the overall user experience.
Here’s the math. Suppose an e-commerce checkout flow calls 50 microservices, each with a p99.9 latency of 500ms. The probability that a single service does not hit its tail threshold on a given request is 0.999. The probability that none of the 50 services hits its tail threshold is 0.999^50 ≈ 0.951. That means roughly 5% of checkout requests will experience a tail-latency hit from at least one downstream service, making the combined p95 of the frontend roughly equal to the p99.9 of each backend.
Dean and Barroso documented this compounding effect at Google scale: the more services involved in a request path, the more likely at least one will contribute a tail event, and the more the aggregate user experience diverges from any single service’s percentile metrics [1]. This is where p99 alone becomes insufficient and p99.9 monitoring becomes a business necessity for any service with substantial fan-out.
Choosing the Right Percentile for Your SLO: A Decision Framework
Three questions determine which percentile belongs in your SLO:
- How revenue-critical is this endpoint? A product search API has different tolerance than a payment processing endpoint.
- How many downstream services does it fan out to? Higher fan-out means tail compounding (see above), tighten the percentile.
- What’s your traffic volume? At 10M requests/day, p99 = 100,000 users experiencing worst-case latency daily. That number reframes “just 1%” immediately.
Three deployable SLO templates, rooted in the Google SRE Workbook’s SLO implementation methodology [3]:
- Standard Web Application: p95 < 500ms, p99 < 2,000ms
- Payment / Auth Critical Path: p99 < 1,000ms, p99.9 < 3,000ms
- Background Job / Async API: p99 < 10,000ms
These are starting points, not universal truths. Your SLO should be calibrated to your actual p99 baseline. Run a baseline load test first, then set your SLO at 20% above your measured p99 under normal load, giving you headroom before paging.
How to Measure P99 Latency in Load Testing
The fundamental algorithm: sort all response times in ascending order and take the value at the 99th percentile rank. The formula is:
index = ceil(P/100 × N)
Where P is the desired percentile (99) and N is the total number of observations. For a small worked example, consider 10 response times in milliseconds:
[120, 130, 145, 160, 175, 190, 210, 250, 400, 8200]
Sorted ascending (they already are). P99 index = ceil(0.99 × 10) = ceil(9.9) = 10. The 10th value is 8,200ms. That’s your p99.
At high request volumes, many observability tools compute percentiles using histogram buckets rather than raw values. This introduces approximation error, a request that took 1,950ms might be bucketed into a 1,000–2,000ms range, and the reported p99 becomes the bucket boundary rather than the actual value. For SLO-grade accuracy, raw-value computation or high-resolution histogram buckets (50ms or narrower) are required.
Designing a Load Test That Captures Accurate P99 Data
Five design decisions determine whether your p99 measurement reflects production reality:
- Test duration: Run at least 15–20 minutes of sustained steady-state load after ramp-up completes. P99 anomalies tied to GC cycles (which may trigger every 5–10 minutes) won’t appear in a 3-minute test.
- Virtual user count: Match your measured peak production concurrency, not a round number you picked because it seemed reasonable. If production peaks at 1,200 concurrent sessions, test at 1,200.
- Think times: Inject realistic think times between requests, typically 1–5 seconds for web applications. Zero think time creates an artificial hammering pattern that inflates tail latency and doesn’t represent real browsing behavior.
- Endpoint coverage: Test the full user journey, including error-handling and authenticated paths. P99 spikes frequently live on logout flows, session-refresh endpoints, and error pages, paths that happy-path testing misses.
- Environment parity: Your test environment’s CPU, memory, network topology, and database size should match production. A p99 measured on a half-sized staging database with 1/10th the data is a comparison between apples and hypothetical oranges.
Reading P99 Results in WebLOAD’s Real-Time Dashboard

WebLOAD by RadView surfaces percentile metrics natively during load test execution. The Percentile Response Time report displays p50, p95, and p99 response times updating live as virtual users execute transactions, no post-processing required. Alongside this, the Transaction Statistics panel provides a time-series trend view: you can watch p99 climbing during ramp-up, stabilizing (or spiking) at peak load, and recovering during cool-down.
The operational advantage is automated threshold alerting. Configure a rule such as “alert if p99 exceeds 2,000ms for more than 60 consecutive seconds during the test”, mapping directly to the Standard Web Application SLO template defined earlier. When that threshold breaches, the test flags the violation immediately rather than burying it in a post-test report you might not read until tomorrow.
These alerts can be integrated into CI/CD pipelines so that a p99 threshold breach during a performance regression test automatically fails the build. This turns p99 monitoring from a reactive dashboard exercise into a shift-left performance gate: no code ships if its p99 regresses beyond the SLO.
Common Measurement Mistakes That Invalidate Your P99 Results
Before you trust your p99 number, verify all four conditions:
- Insufficient sample size. Computing p99 from 200 requests means your p99 is derived from the 2nd-slowest response, a single anomalous request shifts the entire metric. Fix: Ensure at least 1,000 requests per endpoint under measurement, ideally 10,000+ for SLO-grade confidence.
- Including ramp-up in the calculation. During ramp-up, JIT compilers are warming, caches are cold, and connection pools are filling. These response times are not representative of steady-state behavior. Fix: Exclude the first 2–5 minutes of test data from percentile calculations, or configure your tool to begin measurement only after ramp-up completes.
- Single-origin testing with distributed users. If your users span three continents but your load generators run from a single data center, your p99 misses network-induced latency variation entirely. Fix: Distribute load generators across at least the same regions as your top 3 user populations, following best practices for creating realistic load testing scenarios.
- Pre-warmed environment without cold-start representation. If your test environment was pre-warmed before the test (caches populated, JVM compiled, connection pools established), your p99 won’t reflect the cold-start spikes real users experience after deployments or scale-out events. Fix: Include a cold-start phase in your test plan, or run a separate cold-start p99 measurement.
What High P99 Latency Actually Does to Your Users (and Your SLA)
A p99 above 2,000ms means 1 in every 100 users waits more than 2 full seconds for a response. At 1 million daily requests, that’s 10,000 frustrated users every day. At 10 million, it’s 100,000. The phrase “just 1%” loses its comfort quickly when translated to headcount.
Rob Ewaschuk’s observation bears repeating in this context: “the 99th percentile of one backend can easily become the median response of your frontend” [2]. In a microservices architecture where a single page load triggers 10–20 backend calls, one service’s p99 spike cascades into the majority of your users’ page-load time. This is not a theoretical risk, it is the documented operational reality at Google scale and at any organization running more than a handful of interconnected services.
User behavior research consistently finds that 53% of mobile users abandon an app if load time exceeds 3 seconds, and 79% of those users won’t return to retry. When your p99 crosses that threshold, you’re not just breaching an SLA, you’re generating churn at a rate your retention team can’t compensate for.
Translating P99 Into SLA Language Stakeholders Understand

Engineers speak in milliseconds; executives speak in customer impact. Bridge the gap with this template:
Our p99 latency is [X ms], which means [Y users per day] experience response times above that threshold. Under our current SLA, a p99 above [Z ms] for more than [W% of the measurement window] constitutes a breach, triggering [contractual consequence: credit, escalation, penalty].
For example: “Our p99 latency is 3,500ms, which means 14,000 customers per day wait more than 3.5 seconds for checkout to load. Under our SLA, a p99 above 2,000ms for more than 5% of any 24-hour window constitutes a breach, triggering a 10% service credit.”
The Google SRE Workbook models this with their multi-threshold approach: [p90 < 100ms, p99 < 400ms] [3]. The dual-threshold structure is critical because it captures both the typical experience and the tail, an SLA defined only on average latency is a legal and operational risk, since an average can comply while thousands of users suffer. For a deeper dive into how SLA definitions connect to load testing strategy, see the SLA for performance and load testing.
The Hidden Cost of SLA Breaches: Beyond Contractual Penalties
Contractual penalties are the visible line item. The hidden costs are larger:
- Silent churn. Users who hit a slow experience don’t always file a complaint, they simply don’t return. The correlation between tail latency and retention is stronger than satisfaction surveys capture, because the worst-affected users self-select out of your funnel before you ever survey them.
- Support ticket volume. P99 spikes generate support contacts. If your support cost-per-ticket is $15–25 (a common range for SaaS products), and a p99 spike generates 500 extra tickets in a week, that’s $7,500–12,500 in direct cost, before accounting for the engineering time to diagnose the root cause.
- Engineering opportunity cost. Every hour a senior engineer spends in an incident channel responding to a production latency spike is an hour not spent on reliability improvements or feature delivery. Dean and Barroso’s work at Google documented that these tail-latency incidents consume disproportionate engineering attention precisely because they’re intermittent and difficult to reproduce, the exact characteristics that proactive p99 monitoring and load testing are designed to catch before production [1].
Frequently Asked Questions
What Is Considered a Good P99 Latency?
There is no universal answer because “good” is relative to your endpoint’s function and your users’ expectations. That said, for synchronous user-facing web APIs, p99 below 1,000ms is a common industry target. For payment and authentication flows, aim for p99 below 500ms. For asynchronous or batch-processing endpoints, p99 below 5,000–10,000ms may be acceptable. The right approach is to measure your current baseline under realistic load, set your SLO at a level your infrastructure can sustain without heroic intervention, and tighten it as you optimize.
What Is the Difference Between P99 and P99.9, and When Does It Matter?
P99 captures the experience of the slowest 1-in-100 users; p99.9 captures the slowest 1-in-1,000. The distinction matters primarily in high-fan-out architectures. If a single request touches 50 downstream services, the probability of hitting at least one service’s p99.9 on any given request is approximately 5% (0.999^50 ≈ 0.951). For endpoints with low fan-out and moderate traffic, p99 is sufficient. For checkout flows, authentication chains, or any path where a single slow response blocks the user, p99.9 gives you the visibility to catch compounding tail events.
Is 100% Percentile Coverage Worth the Investment?
Not always. Tracking p100 (the absolute maximum response time) sounds thorough, but in practice it captures one-off anomalies, a single request hit by a network partition, a one-time GC full collection, that are not representative of systemic issues. P100 is noisy, non-reproducible, and rarely actionable. Your engineering time is better spent driving p99 down reliably than chasing the single worst request in a million. Track p100 if required for compliance, but don’t alert on it or use it for SLO decisions.
How Do You Reduce P99 Latency Once You’ve Identified It’s Too High?
Start with diagnosis, not optimization. Profile your application under load to identify where time is spent in the p99 path, and use a systematic approach to test and identify bottlenecks in performance testing. The most common culprits, in order of frequency: (1) Garbage collection pauses, right-size your heap and tune GC algorithm parameters (e.g., switch from throughput to low-pause collectors). (2) Database query tail, identify queries that occasionally scan rather than seek; add covering indexes or implement query timeouts. (3) Thread/connection pool exhaustion, increase pool sizes or implement backpressure so requests queue rather than contend. (4) Cold cache misses, pre-warm caches on deployment and implement cache-aside patterns for frequently accessed data. (5) Synchronous downstream calls, offload non-critical work to async queues so the user-facing response doesn’t wait for completion. Each fix should be validated with a load test that compares p99 before and after the change under identical conditions.
Can You Accurately Measure P99 in a Staging Environment That Doesn’t Match Production Scale?
You can measure a p99, but it won’t match production. Staging environments with smaller databases, fewer concurrent users, and different network topologies produce fundamentally different tail behavior. GC pressure scales with heap usage and allocation rate. Connection pool contention scales with concurrency. Cache hit ratios depend on working set size. If your staging environment runs at 10% of production capacity, your staging p99 is measuring a different system. The mitigation: run your heaviest percentile-focused tests against production-parity environments, or use traffic replay from production logs with parameterized sessions to simulate realistic load distribution.
Performance benchmarks and latency thresholds cited in this article are illustrative examples based on common engineering scenarios. Actual p99 values will vary significantly depending on your infrastructure, traffic patterns, application architecture, and network conditions. Always validate performance targets against your own load test results and SLA requirements.
References
- Dean, J. & Barroso, L.A. (2013). The Tail at Scale. Communications of the ACM, 56(2), pp. 74–80. Retrieved from https://research.google/pubs/the-tail-at-scale/
- Ewaschuk, R. (2017). Monitoring Distributed Systems. In B. Beyer, C. Jones, J. Petoff, & N.R. Murphy (Eds.), Site Reliability Engineering: How Google Runs Production Systems, Chapter 6. O’Reilly Media. Retrieved from https://sre.google/sre-book/monitoring-distributed-systems/
- Thurgood, S. & Ferguson, D., with Hidalgo, A. & Beyer, B. (2018). Implementing SLOs. In The Site Reliability Workbook: Practical Ways to Implement SRE, Chapter 2. O’Reilly Media / Google, Inc. Retrieved from https://sre.google/workbook/implementing-slos/


