Picture this: a growth-stage SaaS team lines up a product launch behind a paid campaign, expecting maybe 3x their normal weekday traffic. The campaign overdelivers. At roughly 2.8x normal concurrency, the checkout flow starts throwing 500s, the database connection pool saturates, and the on-call engineer spends the next 90 minutes restarting services while conversions crater. The postmortem number – lost revenue plus the discount they had to offer disappointed customers – dwarfed what a two-week load testing engagement would have cost.

If you’re reading this, you’re probably trying to avoid being that team. And you almost certainly have two questions before anything else: How long will this take? and What will it actually cost? Most guides dodge both with a cheerful “it depends.” This one won’t.
Load testing, briefly, is simulating realistic concurrent user or transaction volume against your application to see how response times, throughput, and error rates behave under pressure – and where they break. That’s the last definition you’ll get here. The rest is an operational playbook drawn from three decades of RadView engagements: what makes a load testing project succeed, what buyers consistently miss, and how to avoid the procurement mistakes that turn a straightforward test into a stalled, over-budget mess.
Here’s the roadmap: deciding whether you need testing now, choosing between in-house and external sourcing, preparing your application, the week-by-week process and timeline, selecting tools and partners, a transparent cost breakdown, the deliverables you should demand, and closing the loop with remediation and continuous validation. Let’s get into it.
- When Your Application Actually Needs Load Testing (A Decision Framework)
- Build vs. Buy: In-House Load Testing vs. External Services (and the Hybrid Truth)
- Preparing Your Application: The Pre-Test Readiness Checklist
- The Load Testing Process: A Week-by-Week Timeline of What to Expect
- Selecting Load Testing Tools and Partners
- What Load Testing Actually Costs: A Transparent Breakdown
- The Deliverables You Should Expect
- After the Test: Remediation, Retesting, and Continuous Validation
- Frequently Asked Questions About Getting Your Application Load Tested
- References
When Your Application Actually Needs Load Testing (A Decision Framework)
Before you scope anything, gut-check whether this is the right moment. Run through these triggers – if you tick even one, you should be planning a test now, not after the next incident:
- You’re launching a new application or shipping a major release that changes capacity assumptions.
- You’re forecasting a 2 – 5x traffic increase (seasonal peak, campaign, new market).
- You’re changing architecture: cloud migration, database engine upgrade, or CDN implementation.
- A regulation or contract mandates resilience or capacity testing.
- You just had an outage and need to prove the fix holds under load.
Why the urgency? Availability math is unforgiving. As Google’s Site Reliability Engineering team documents, a system targeting 99.99% availability can be down for only about 52.56 minutes across an entire year and still hit its target [1]. That’s under an hour. A single unhandled traffic surge can burn your whole annual error budget in one afternoon. And the fallout isn’t just downtime minutes – consequences span lost revenue, brand and reputation damage, regulatory noncompliance, and eroded stakeholder confidence [2].
In our experience, the growth-inflection and architecture-change triggers are the ones that most often precede a frantic, unbudgeted testing scramble – precisely because teams treat them as “just infrastructure work” rather than capacity risk. Get ahead of them.
Pre-Launch and Major Releases: Testing Before You Ship
A brand-new application or a significant release is your highest-value testing moment because your capacity assumptions have never been validated against real concurrency. This is where you define objectives and expected volume first – the documented first step of any load testing effort [3] – then model your critical user journeys, following best practices for testing web applications as you go.
For an e-commerce release, that journey is usually login → search → add to cart → checkout, and you’d validate something like “5,000 concurrent users completing that flow with p95 checkout latency under 1 second.” Anchoring pre-launch objectives to a recognized standard helps here; the ISTQB Performance Testing certification syllabus provides a vocabulary and objective-setting structure your whole team can align on.
Growth Inflection Points and Traffic Surges
There’s a meaningful difference between predictable growth and a spike. Predictable growth – your user base doubling over two quarters – warrants a load test sized to your projected 2 – 5x peak. A spike is sudden: it originates from marketing campaigns, viral content, or unforeseen events, and it can overwhelm servers with little warning [4]. Shared server environments are disproportionately vulnerable to these bursts, since one tenant’s surge starves the others.
If your traffic profile includes flash sales or event-driven bursts, a steady-state load test isn’t enough – you need spike testing that models the burst arrival rate and validates how fast your system recovers once it subsides.
Architecture Changes and Compliance-Driven Testing
Cloud migrations, database engine upgrades, and CDN swaps all change performance characteristics in ways that are genuinely hard to predict from code review alone. A migration that looks identical functionally can behave completely differently under 4,000 concurrent connections when a managed database enforces different connection limits than your old self-hosted instance.
These major architecture shifts are exactly the scenarios where external testing expertise tends to pay off [5]. The same applies to compliance-mandated resilience testing and post-incident validation: when a regulator or a postmortem requires you to prove behavior under load, you need a defensible, structured methodology. The NIST Technical Guide to Testing and Assessment (SP 800-115) offers a framework for documenting that rigor.
Build vs. Buy: In-House Load Testing vs. External Services (and the Hybrid Truth)
Most enterprises frame this as binary – build a team or hire one. That’s the wrong question. The right one is: for which type of testing?
Here’s the decision rule that holds up across engagements: if you ship changes every few days – especially a microservices architecture where any of 50+ services could regress – you need lightweight, automated in-house tests running in CI/CD [5]. External engagements can’t keep pace with that cadence. But for big, infrequent, high-risk events – a major release, a cloud migration, a regulatory-mandated capacity certification – external specialists earn their fee by bringing scale, tooling, and experience you’d otherwise build from scratch for one event.
Now the ROI logic. Google’s SRE team offers a reproducible way to size the value of reliability: for a service generating $1M, moving availability from 99.9% to 99.99% is worth $1M × 0.0009 = $900 [1]. If pushing that extra “nine” costs more than $900, you’re overspending on reliability; if less, invest. Flip that reasoning onto testing: estimate the revenue your outage-prevention buys, and compare it to the testing spend. Sometimes a lightweight in-house approach is genuinely the smarter, lower-cost call – and we’ll say so.
The In-House Case: Control, Cost, and the Skills Gap
In-house testing gives you control and a low marginal cost per test once you’ve built the capability. The catch is that “capability” is heavier than teams expect. The dominant cost and time drivers are specialized tools, infrastructure, and skilled personnel [6] – and the skills gap is the one most often underestimated.
Provisioning and tearing down load generators that can push 10,000+ virtual users, writing correlation logic for dynamic session tokens, and interpreting percentile distributions aren’t skills your average functional QA engineer already has. Budget for either hiring or training before you commit to a build.
When to Bring in an External Team
Bring in an external team for the events where getting it wrong is expensive and getting a second chance is unlikely: cloud migrations, major releases, and regulatory-mandated tests [5]. These are precisely the moments where the depth of a specialist’s experience – knowing which failure modes to hunt for – compresses timeline and reduces risk.
The risk of external-only reliance is knowledge leakage: if every test lives with an outside team, your engineers never build the muscle to catch regressions between engagements. The strongest external partnerships transfer knowledge deliberately, handing back reusable scripts and a documented methodology rather than just a PDF.
The Hybrid Model: How Mature Teams Actually Operate
The model that reflects real enterprise practice layers both. In-house owns continuous coverage – per-commit smoke tests and nightly runs that catch day-to-day regressions. An external team owns strategic validation – full-scale, production-like tests before quarterly releases or ahead of a known high-traffic event.
A platform that supports both modes lets you avoid tool fragmentation between the two. WebLOAD is used this way in a number of enterprises: driving continuous in-house pipeline tests while also powering large, one-off strategic validations. That said, if your continuous needs are simple HTTP smoke tests, a lightweight open-source tool in the pipeline may cover them perfectly well – reserve the heavier platform for where its scale and protocol breadth actually matter.
Preparing Your Application: The Pre-Test Readiness Checklist
The single biggest predictor of a smooth engagement isn’t the tool – it’s readiness. Projects stall when the test team is ready but the application, environment, or stakeholders aren’t. Here’s the pre-flight checklist that separates smooth engagements from stalled ones:
- Architecture diagram and user-flow maps – so scenarios reflect reality, not guesses. What good looks like: a current diagram plus the top 3 – 5 revenue-critical journeys.
- Peak-load data – historical concurrency, requests-per-second, and traffic shape. What good looks like: a real dataset from your busiest recent day, not a hunch.
- A production-like test environment – Microsoft’s Azure Well-Architected Framework explicitly recommends “regularly testing in a production-like environment” [7]. What good looks like: same instance sizes, same database tier, representative data volume.
- Access and permissions – APIs, database read access for verification, and monitoring/APM tooling. What good looks like: credentials provisioned before week one, not chased mid-engagement.
- Quantitative success criteria – the framework’s PE:01 recommendation calls for “numerical values that are tied to workload requirements” [7]. What good looks like: “p95 response time < 1s at 5,000 concurrent users, error rate < 1%.”
We publish a performance-engineer-authored readiness checklist and workload-model worksheet you can download to work through each of these systematically. Aligning your success criteria with the ISTQB Performance Testing syllabus keeps your thresholds defensible across teams.
Documentation, Environment, and Access You’ll Need
At minimum, gather three things: a current architecture diagram, mapped critical user flows, and a real peak-load dataset. Add read access to your database (to verify data integrity during and after runs) and integration with your monitoring stack (to correlate client-side latency with server-side resource metrics).
On environment: building a production-mirroring environment is difficult and time-consuming [6], and it’s frequently the phase where timelines slip. The trade-off is straightforward. A production-like environment gives you clean, safe results but costs setup time and infrastructure. Testing against actual production gives perfect fidelity but risks real-user impact. The framework’s guidance leans toward production-like as the default [7] – and following these tips for building a better load testing environment, in the spirit of NIST SP 800-115, keeps the setup auditable.
Getting Executive Buy-In and Defining Success Criteria
Executives fund business cases, not test plans. Translate your ask into dollars using the availability-value logic above: “A 90-minute outage during our peak sale window costs roughly $X; this engagement costs a fraction of that and validates we can handle 3x load.” Then define the SLAs you’ll test against in concrete terms – for example, p99 latency under 200ms and error rate below 0.5% at target concurrency.
Do this before a single test runs, because “acceptable” is a business decision, not an engineering one. When results come back, you’ll want to frame them the way stakeholders think – more on that in the deliverables section.
Can You Load Test in Production? (And When You Shouldn’t)
Yes, carefully – but a production-like environment is the safer default [7]. If you must test in production, put guardrails in place: ramp synthetic traffic to a small percentage of capacity first, schedule during genuine off-peak windows, and isolate test transactions behind a feature flag or tagged test accounts so they don’t pollute real analytics or trigger real fulfillment.
A separate environment becomes mandatory when a failed test could corrupt real customer data, trigger real payments, or violate compliance – which covers most transactional systems. In practice, controlled production testing works best as a supplement to production-like testing, used to validate that lab findings hold under real infrastructure.
The Load Testing Process: A Week-by-Week Timeline of What to Expect
Here’s a realistic five-week engagement. Your mileage varies with complexity, but these ranges reflect typical enterprise timelines:
| Phase | Duration | Relative Cost | Key Output |
|---|---|---|---|
| 1. Scoping & scenario design | 1 – 2 weeks | $ | Test plan, workload model, success criteria |
| 2. Environment setup & scripting | 1 – 3 weeks | $$ | Validated, parameterized test scripts |
| 3. Baseline & scenario validation | 2 – 4 days | $ | Baseline metrics, verified scenarios |
| 4. Full load execution | 2 – 4 days | $$ | Percentile latency & error data under scaling VUs |
| 5. Analysis & remediation retest | 1 – 2 weeks | $$ | Findings, remediation plan, retest results |
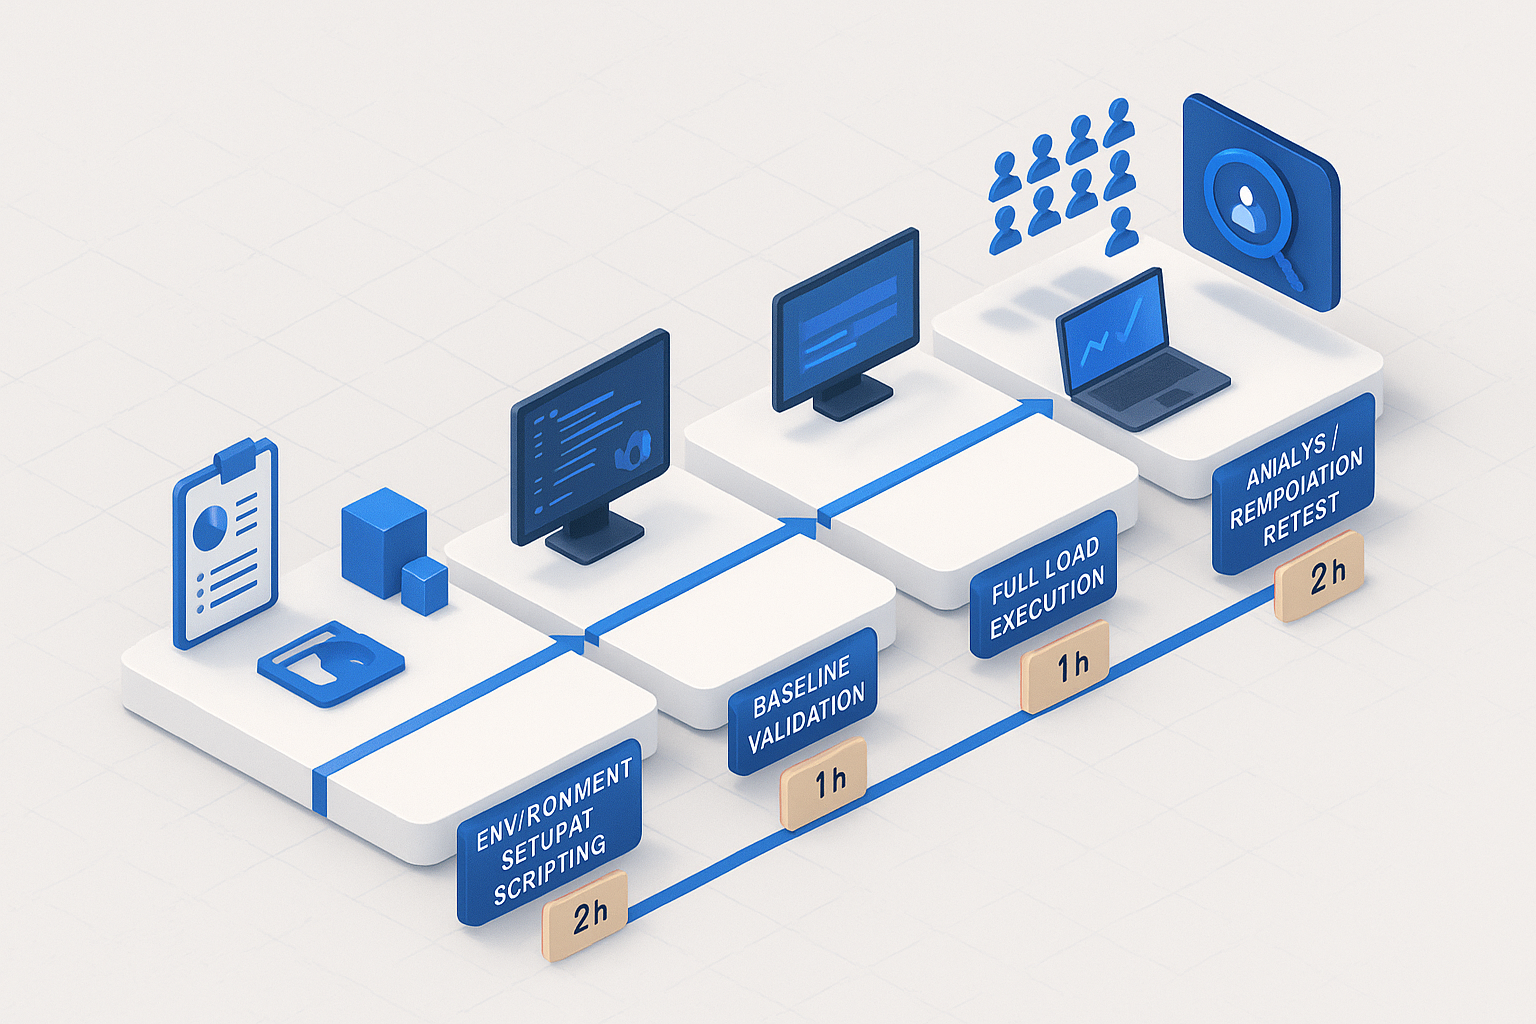
The documented first stage is identifying objectives and expected volume [3] – everything downstream depends on getting scope right. The phases that consume the most time are usually environment setup and scripting, driven by the difficulty of mirroring production and the specialized personnel required [6]. This structure aligns with the phased approach in the ISTQB Performance Testing syllabus.
Cloud-based load generators compress the timeline meaningfully – provisioning 20 geo-distributed generators takes minutes instead of the days it takes to rack physical hardware. The phase where projects most often slip? Environment setup, when access wasn’t provisioned during readiness.
Phase 1 – 2: Requirements, Scenario Design, and Script Development
These front-loaded weeks build the foundation. You define objectives [3], then construct a workload model – the mix of user behaviors weighted realistically. A typical retail model might be 70% browse, 20% search, 10% checkout at a 5,000-VU peak, because if you test 100% checkout you’ll over-stress payment services and under-stress your search index versus reality. For structuring these workloads, our guide to creating realistic load testing scenarios walks through the process.
Scripting then captures each journey and parameterizes the dynamic bits (session tokens, cart IDs, CSRF tokens) so 5,000 virtual users don’t all replay one recorded session. We provide a downloadable workload-model spreadsheet to structure this. Expect 2 – 5 weeks combined, weighted toward scripting complexity.
Phase 3 – 4: Baseline, Validation, and Full Load Execution
A baseline run at low concurrency confirms scripts work and captures reference metrics. Then you scale up and capture the real data – and here’s a discipline that separates useful reports from misleading ones: report percentiles, not averages. Metrics are distributions. As the SRE team puts it, “a typical request is served in about 50 ms, [but] 5% of requests are 20 times slower” [8] – that’s a full second for one in twenty users, entirely invisible in a mean. A high-order percentile like p99 shows your plausible worst case; the median shows the typical experience [8].

Annotated dashboards should plot p50/p95/p99 response time against ramping VUs so you can see exactly where the curve bends. For standardized context on how responsiveness metrics are defined, the Web Vitals guidance is a useful reference. Execution itself is fast – 2 – 4 days – because the hard work was the setup.
Phase 5: Remediation Testing and Iterative vs. Waterfall Approaches
After the team fixes findings, you retest to confirm the fixes held. Plan for two retest cycles in most engagements – the first often surfaces a secondary bottleneck the original one was masking. Measure each retest against your baseline so improvement is quantified, not assumed; consistent measurement against baselines over time is exactly what detects degradation and scaling gaps [7].
Choose iterative over waterfall when you’re shipping continuously: rather than one big test at the end, embed smaller tests each sprint so regressions surface within days, not at a quarterly gate.
Selecting Load Testing Tools and Partners
Score tools on what enterprise buyers actually weigh, not on marketing feature lists. The six dimensions that matter:
| Criterion | Why It Matters |
|---|---|
| Protocol coverage | Can it test your actual stack (HTTP, WebSocket, gRPC, plus enterprise protocols like SAP/Oracle/Citrix)? |
| Max concurrent VUs | Will it scale to your real peak – 50k, 100k+? |
| CI/CD integration | Can tests run as pipeline gates automatically? |
| RBAC / governance | Can you control who runs what in a regulated org? |
| Reporting depth | Percentile analysis, correlation to server metrics? |
| Support SLA | Response time when a test blocks a release? |
WebLOAD sits in the enterprise-commercial tier here, with support for 150+ protocols and a 30-year track record – strongest when you need broad protocol coverage (including SAP, Oracle, and Citrix), governance controls, and enterprise support. Transparently: if your stack is pure REST microservices and your team lives in code, a developer-centric open-source tool may be the better cultural and cost fit. Choose the category that matches your constraints. For the deeper tool-selection analysis, see our guide on how to choose a performance testing tool.
Open-Source vs. Commercial vs. SaaS-Based: A Decision Matrix
The rules that decide the category:
- Need SAP/Oracle protocol support plus RBAC and audit trails → enterprise commercial platform.
- Developer-centric microservices team with strong scripting skills and simple protocols → open-source tool.
- Want scale without managing infrastructure and can accept per-run pricing → SaaS-based platform.
One honest caveat: some open-source approaches require Scala, Java, or JavaScript scripting skills, which is a real adoption barrier for teams whose testers aren’t developers. Factor the learning curve into total cost, not just the $0 license.
Running a Proof-of-Concept and Evaluating Vendors
A defensible POC tests against your reality, not a vendor’s demo scenario. Set at least three concrete success criteria before you start:
- Simulate your target peak (e.g., 10,000 VUs) on a representative journey.
- Confirm it integrates with your specific CI/CD platform.
- Verify it supports every protocol in your stack – test the awkward one, not just HTTP.
The most common evaluation mistake we see: running the POC on a trivial scenario that every tool passes, then discovering the gaps in production. Make the POC hard on purpose.
Contract and Licensing Considerations
Three models dominate:
- Perpetual – high upfront, low ongoing; best if you test frequently at stable scale.
- Subscription – predictable annual cost; best for steady, ongoing programs.
- Consumption-based (per VU-hour) – pay for what you run; best for spiky or occasional needs, but model it carefully – a few large tests at 50k VUs can eclipse a subscription fast.
Model your expected VU-hours against each before signing. The cheapest sticker price often isn’t the lowest total cost of ownership at your actual usage.
What Load Testing Actually Costs: A Transparent Breakdown
Most of the industry hides this. Here’s an itemized view. Total cost breaks into four buckets:
| Cost Bucket | Ballpark Range | Primary Driver |
|---|---|---|
| Tool licensing | $0 (open-source) to $30k+/yr (enterprise) | Feature/protocol breadth, VU capacity |
| Cloud load-generator infra | $500 – $10k+ per major test | VU count × test duration |
| Services / consulting | $10k – $75k+ per engagement | Complexity, scenario count |
| Internal engineering time | 40 – 200+ hours | Environment prep, remediation |
The dominant drivers are specialized tools, infrastructure, and skilled personnel, plus the significant compute needed to simulate large user volumes [6]. The two biggest multipliers are VU count and test duration – simulating 50,000 users for four hours costs far more in generator compute than 5,000 for one.
Watch the hidden costs that ambush first-time buyers: test data management (generating and refreshing realistic datasets) and environment maintenance (keeping your production-like environment actually production-like as the app evolves).
Tooling, Infrastructure, and People: The Four Cost Buckets
Each bucket flexes with your parameters. Licensing scales with protocol needs and VU ceilings. Cloud infrastructure, often priced per virtual-user-hour, scales directly with VU count × duration – which is why teams sometimes discover the “cheap” open-source tool still runs up a serious cloud bill when they push six-figure concurrency [6]. Services scale with scenario complexity. Internal time scales with how ready your environment was to begin with.
The ROI Question: Testing Cost vs. the Cost of Downtime
Use a reusable formula: (revenue per hour × outage duration) + reputation factor, weighed against total testing spend. Then apply the SRE availability-value method to size the benefit: for a $1M service, buying an extra nine of availability (99.9% → 99.99%) is worth $900 [1]. Scale that to your revenue. A retailer doing $50M annually gains $45,000 in expected value from that same reliability increment – which comfortably justifies a $40k engagement if it prevents even one peak-window outage. For the strategic framing of this trade-off, see our strategic load test planning guide.
The Deliverables You Should Expect
Hold any vendor – or your own team – to this list. A quality engagement returns:
- Test plan documentation – objectives, workload model, scenario descriptions.
- Raw results data plus an analysis report – with latency shown as p50/p95/p99, not averages [8].
- Bottleneck identification and remediation recommendations – specific, ranked, actionable.
- An executive risk-assessment summary – one page, framed in business terms.
- A reusable regression test suite – the deliverable clients most often forget to demand.
Annotated dashboards showing percentile curves under scaling VUs are what a professional deliverable looks like. Our report guide for engineers and executives breaks down the structure in depth.
From Raw Data to an Executive Risk Assessment
The analysis report is for engineers; the executive summary translates it into risk. Concretely: “p99 latency of 4.2s at peak load correlates with a projected 10% checkout abandonment.” That translation is credible because slow load times measurably drive users away – the BBC found it lost an additional 10% of users for every additional second its site took to load [9]. Wire your findings to that kind of established impact and executives will act. The Web Vitals guidance formalizes the responsiveness-to-business-impact link.
The Regression Suite: Your Ongoing Validation Asset
The regression suite has the longest tail of value. Wired into your CI/CD pipeline as a nightly gate, it catches performance regressions before they ship – the mechanism behind consistent measurement against baselines to detect degradation over time [7]. Don’t let a vendor walk away without handing you runnable, parameterized scripts you own.
After the Test: Remediation, Retesting, and Continuous Validation
Findings without a prioritization scheme become a backlog that never gets done. Rank fixes on an impact-vs-effort matrix. The primary root causes are consistent across systems – inefficient code, network delays, and resource limitations [10] – and they map to concrete fixes:
- Unindexed query causing DB CPU saturation → add index. High impact, low effort – do first.
- N+1 query calls → eager-load / batch. High impact, medium effort.
- Thread-pool exhaustion → tune pool size + add backpressure. High impact, medium effort.
Then validate: re-run and compare against baseline. Continuous performance testing – ongoing evaluation of speed, stability, and scalability across the lifecycle, integrated into CI/CD [11] – ensures those wins don’t quietly regress, as our guide to continuous performance testing details. When your app auto-scales, validate the scaling behavior itself; the Kubernetes autoscaling documentation covers the mechanisms to test against.
Prioritizing Fixes with an Impact-vs-Effort Matrix

Plot each finding in one of four quadrants. High-impact / low-effort (that unindexed query) goes first – it’s free performance. High-impact / high-effort (re-architecting a synchronous call chain) gets scheduled and resourced. Low-impact / low-effort fixes get batched into cleanup. Low-impact / high-effort items get parked, honestly, forever. We publish a performance-engineer-authored version of this matrix to structure the exercise, grounded in the root-cause categories above [10].
Building Continuous Performance Testing into CI/CD
Embed load tests as pipeline gates with explicit performance budgets. A practical gate: fail the build if p95 > 1s or error rate > 1%. Tier your tests to balance speed and coverage – lightweight smoke tests on every commit (finished in under two minutes so they don’t block developers), full-scale runs nightly.
This is where AI-assisted capabilities earn their keep today: anomaly detection flags a percentile drifting out of its normal band across builds, and self-healing scripting repairs tests when a UI selector or endpoint changes, cutting maintenance toil. The guardrail: these accelerate analysis, they don’t replace it – a human still decides which regression is acceptable and which blocks the release. Validate scaling behavior against the Kubernetes autoscaling docs when your pipeline exercises auto-scaling paths.
Establishing Baselines, Alerting, and a Testing Cadence
Set a baseline, then alert on drift – for example, page anyone if p95 rises more than 20% above the rolling baseline. On cadence: run full-scale tests every release and nightly smoke tests continuously, with an additional dedicated test ahead of any known high-traffic event. Consistent measurement against baselines over time is what surfaces slow degradation and scaling gaps before they become incidents [7]. For the strategic layer on cadence and business continuity, see our strategic planning guide.
Frequently Asked Questions About Getting Your Application Load Tested
How long does load testing take, and how much does it cost?
A typical enterprise engagement runs about 4 – 6 weeks end to end, with environment setup and scripting consuming the most time [6]. Cost spans roughly $10k for a lightweight external test to $75k+ for a complex multi-scenario engagement, driven primarily by VU count and test duration. Cloud generators, often priced per virtual-user-hour, compress the timeline but scale with concurrency.
Is 100% load test coverage worth the investment?
Honestly, no – and chasing it wastes budget. Reliability cost is nonlinear; each incremental “nine” of availability can cost dramatically more than the last [1]. Test your revenue-critical journeys and highest-risk paths thoroughly, and accept “good enough” on low-traffic admin screens. Coverage should follow business impact, not vanity completeness.
Can we load test in production?
You can, with guardrails – ramp to a small traffic percentage, run off-peak, and isolate synthetic transactions behind feature flags. But a production-like environment is the recommended default [7], and a separate environment is mandatory when a failed test could corrupt real data or trigger real payments. Controlled production testing works best as a supplement, not a replacement.
What information do load testing vendors need from us?
At minimum: your defined objectives and expected peak volume (the documented first step [3]), a current architecture diagram, mapped critical user flows, a real peak-load dataset, and access to APIs, database (read), and monitoring tools. Have these provisioned before week one – chasing access mid-engagement is the top cause of timeline slippage.
How many retest cycles should we plan for after remediation?
Plan for two in most engagements. The first retest frequently uncovers a secondary bottleneck that the original one was masking – for instance, fixing a database index shifts the constraint to a connection pool. Measure each cycle against your baseline so improvement is quantified rather than assumed.
You now own the full arc: recognizing the trigger, choosing an in-house, external, or hybrid sourcing model, preparing your application properly, knowing the realistic timeline and the actual costs, selecting a tool that matches your constraints, demanding the right deliverables, and closing the loop with prioritized remediation and continuous validation. That’s the whole engine – from downtime risk to proof-of-fix.
The transparency throughout this guide – the itemized costs, the honest tool trade-offs, the phases where projects genuinely slip – is the point. Three decades of engagements taught us that