Picture this: it’s 2:14 a.m. on a Tuesday, and your on-call SRE’s phone lights up. A flash sale campaign drove 3x the expected traffic to your checkout API. Response times spiked past 4,000ms, the payment gateway started timing out, and 22% of transactions failed before anyone noticed. The post-mortem reveals the root cause in under an hour – a database connection pool bottleneck that would have surfaced in a 15-minute load test against the nightly build, had one existed.
This scenario isn’t hypothetical. DORA research confirms the pattern directly: “Once software is ‘dev complete,’ developers have to wait a long time to get feedback on their changes. This usually results in substantial work to triage defects and fix them. Performance, security, and reliability problems often require design changes that are even more expensive to address when discovered at this stage” [1]. The data is unambiguous – performance issues caught late cost exponentially more to resolve.
If your team still treats performance testing as a manual gate squeezed in between staging sign-off and the release window, this guide is written for you. What follows isn’t a conceptual overview. It’s a stage-by-stage engineering playbook – from PR-level smoke tests through production synthetic monitoring – built on research from DORA and Carnegie Mellon’s Software Engineering Institute, with concrete threshold configurations, pipeline code examples, and implementation patterns you can adapt this week.
Here’s the roadmap: we’ll start with the strategic case for pipeline-native performance testing, walk through five specific pipeline stages where tests belong, show you how to configure pass/fail gates that actually stop bad releases, and cover the tooling patterns that make all of it sustainable at enterprise scale.
- Why Performance Testing Belongs Inside Your Pipeline — Not After It
- The Stage-by-Stage Blueprint: Where Performance Tests Live in Your CI/CD Pipeline
- Configuring Pass/Fail Gates: How to Make Performance Tests Actually Stop a Bad Release
- WebLOAD by RadView: Built for Pipeline-Native Performance Testing at Enterprise Scale
- Frequently Asked Questions
- References and Authoritative Sources
Why Performance Testing Belongs Inside Your Pipeline — Not After It
The traditional model – “develop features for three sprints, then hand the build to a performance testing team for a week” – was already fragile in 2018. In 2026, with teams shipping multiple times per day, it’s structurally incompatible with continuous delivery. The question isn’t whether to embed performance testing in your pipeline. The question is how precisely to do it without slowing delivery velocity.
The Real Cost of Late-Stage Performance Discovery

DORA’s continuous delivery research quantifies the damage: organizations that practice continuous delivery see “higher levels of quality, measured by the percentage of time teams spend on rework or unplanned work” [2]. The inverse is equally well-documented, teams without pipeline-integrated testing spend disproportionate time firefighting.
Consider a concrete comparison. Team A catches a memory leak during a PR-gate performance smoke test. A developer fixes the allocation pattern in 2 hours, the PR is re-tested, and the pipeline proceeds. Team B discovers the same memory leak when their production application’s heap exhausts at 3 a.m. under sustained load. The resulting incident consumes 2 days: incident response, emergency hotfix, rollback of the previous deployment, a post-mortem meeting, and follow-up action items. The defect is identical. The cost difference is 16x in engineering hours, before you factor in customer impact.
Carnegie Mellon’s Software Engineering Institute frames this through four pipeline KPIs that every team should track: lead time (how quickly changes reach production), deployment frequency (how often you ship), availability and time to recovery (how reliably the system handles failures), and production failure rate (how often deployments cause incidents) [3]. Late-stage performance discovery degrades all four simultaneously: lead time balloons because releases stall for unplanned investigation, deployment frequency drops because teams lose confidence in their release process, availability suffers from undetected capacity issues, and production failure rate climbs.
Shift Left: What It Actually Means for Performance Engineers
“Shift left” has become a buzzword stripped of operational specificity. For performance engineers, it means two distinct restructurings that must happen in parallel:
Trigger-based shift left moves the execution point of performance tests earlier in the pipeline. Instead of running load tests only before release, you run lightweight smoke performance tests on every pull request (targeting p95 < 500ms for core API endpoints) and full load tests on a nightly schedule against the main branch (targeting 1,000 concurrent virtual users with p95 < 300ms).
Ownership-based shift left distributes test authorship across the team. Developers write and maintain unit-level performance baselines – response time assertions on individual service endpoints – while QA engineers own integration-level load gates that validate cross-service behavior under concurrent load.
The misconception to avoid: shifting left does not mean running a 1,000-user, 30-minute load test on every commit. That would destroy your build times. Think of it as smoke detectors versus fire trucks, you want a detector on every floor (a lightweight performance check on every commit) and the truck stationed at the depot for scheduled, full-scale responses (nightly and pre-release load tests). DORA research specifies the constraint: “Developers should be able to get feedback from automated tests in less than ten minutes both on local workstations and from the continuous integration system” [1]. Your PR-gate performance test must fit within that window.
For the foundational principles underlying this pipeline structure, Martin Fowler’s Foundational Guide to Continuous Integration remains the definitive reference.
Performance Testing vs. Load Testing: Getting the Terminology Right Before You Build
| Test Type | Definition | Pipeline Stage | Frequency |
|---|---|---|---|
| Smoke Performance | Validates core endpoints respond within baseline thresholds under minimal load (5–10 VUs) | PR gate | Every commit/PR |
| Load Test | Validates system behavior at expected peak concurrent user levels | Nightly regression | Nightly on main branch |
| Stress Test | Pushes system to 150–200% of expected peak to identify breaking points | Pre-release | Weekly or pre-release |
| Spike Test | Applies sudden, extreme load increases to validate auto-scaling and recovery | Pre-release | Pre-release or monthly |
| Soak/Endurance Test | Sustains steady load over extended duration (4–12 hours) to detect memory leaks, connection pool exhaustion | Scheduled | Weekly or bi-weekly |
| Scalability Test | Incrementally increases load to identify the capacity ceiling and scaling bottlenecks | Pre-release | Per architecture change |
WebLOAD by RadView supports all six test types natively with protocol-level scripting for HTTP/S, WebSocket, REST, and database connections, enabling teams to implement the full taxonomy from a single platform rather than stitching together multiple tools.
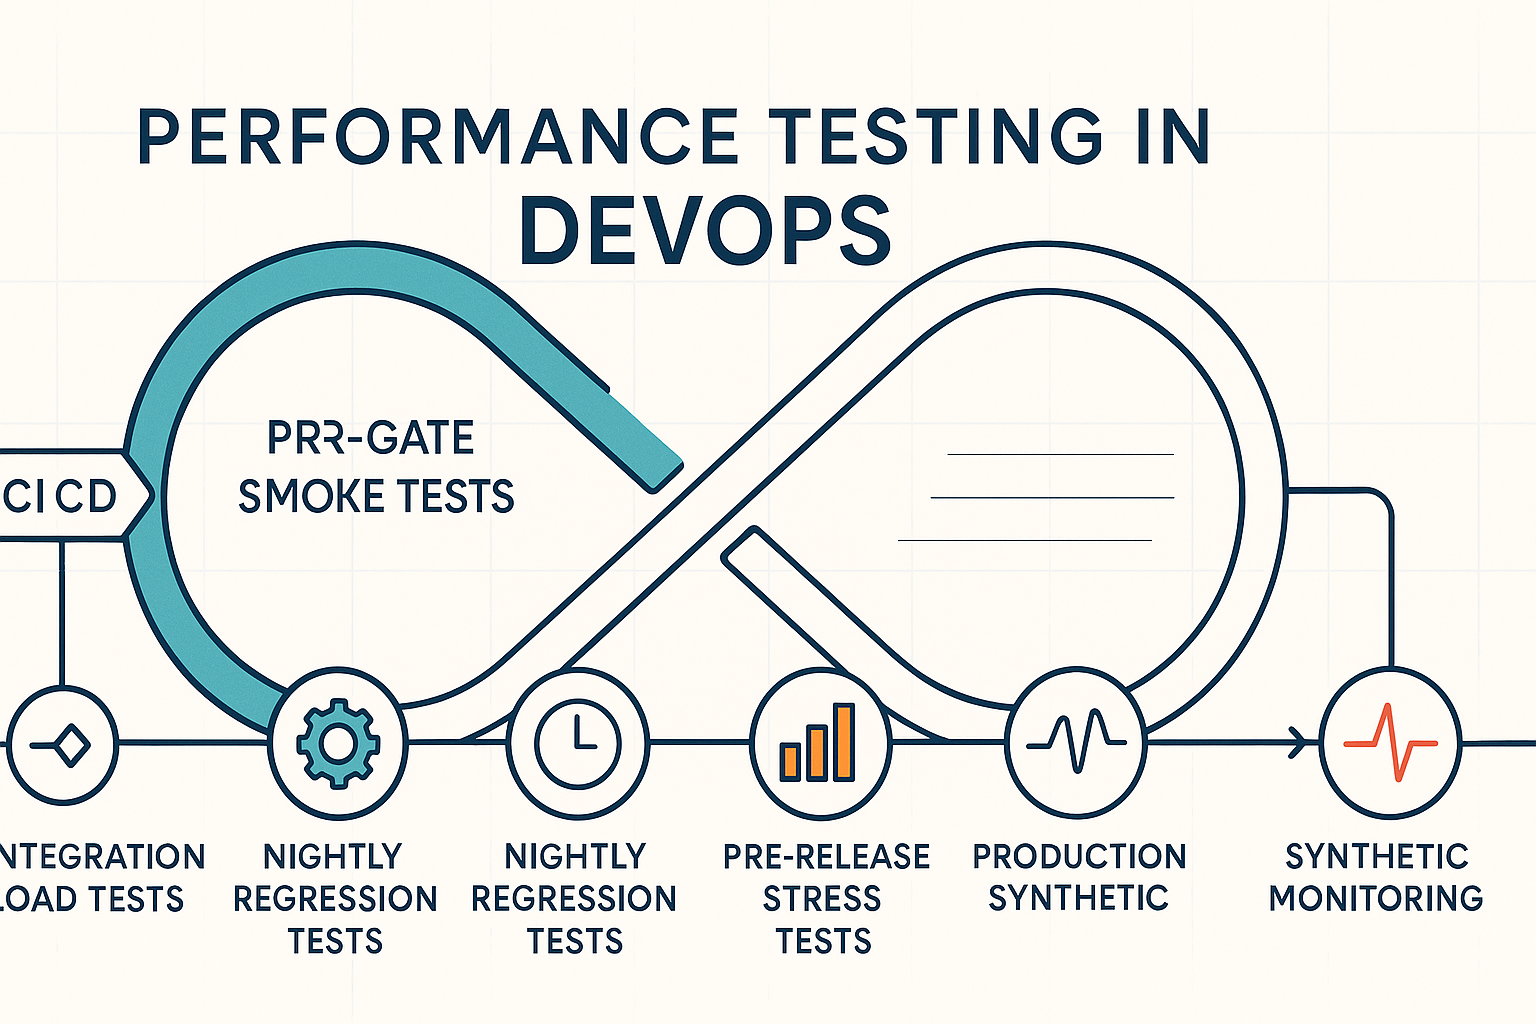
The Stage-by-Stage Blueprint: Where Performance Tests Live in Your CI/CD Pipeline

This is the operational core. Five pipeline stages, each with a specific test type, concrete thresholds, and a trigger condition. Every stage maps directly to the DORA Research on Software Delivery Performance Metrics framework and contributes to improving the SEI/CMU pipeline KPIs: lead time, deployment frequency, availability, and production failure rate [3].
Stage 1 — PR Gate: Lightweight Smoke Performance Tests on Every Commit
The PR gate is your first line of defense. It runs a fast, targeted subset – typically 3–5 critical API endpoints or a single critical user journey – against a lightweight ephemeral environment. The hard constraint: total execution must complete in under 8 minutes to stay within DORA’s ten-minute feedback window [1].
Example thresholds: p95 response time < 500ms, error rate < 0.1%, test duration ≤ 8 minutes.
Here’s a GitHub Actions step invoking WebLOAD’s CLI runner:
- name: Run Performance Smoke Test
  run: |
    wlrun -t tests/performance/smoke_checkout.wlp \
           -r results/perf-smoke/ \
           -threshold p95=500 \
           -threshold error_rate=0.1
  env:
    PERF_GATE_ENABLED: true
The wlrun command returns a non-zero exit code when any threshold is breached, which causes the GitHub Actions step – and therefore the entire PR check – to fail. No manual review, no email notification to ignore. The pipeline stops.
Stage 2 — Integration Build: Load Tests at the Service Boundary
The integration build is the first stage where multi-service load testing becomes meaningful. Here you apply concurrent virtual users to validate API contracts, database query performance, and downstream dependency behavior under realistic concurrency.
Target load: 20–25% of expected production peak. If your production peak is 800 concurrent users, your integration load test runs at 200 virtual users.
Example thresholds: p95 < 800ms, p99 < 1,500ms, error rate < 0.5%.
A concrete scenario: an e-commerce checkout API performs acceptably at 50 concurrent users in isolation. But at 150 concurrent users, the inventory service introduces 200ms of additional latency under load, causing the checkout API’s p95 to spike to 1,200ms. Downstream timeout cascades cause 3% of transactions to fail. No unit-level test catches this. Only an integration-stage load test with realistic service interaction patterns surfaces the bottleneck before it reaches staging.
Stage 3 — Nightly Regression: Full Load Tests and Trend Analysis
The nightly run is your regression safety net. Execute the complete user journey set at or near expected peak load (1,000 concurrent virtual users for 30 minutes) against a production-equivalent environment.
Example thresholds: p95 < 300ms, p99 < 600ms, error rate < 0.5%, throughput regression < 10% vs. 7-day rolling average.
The critical nuance here is trend-based regression detection. A response time of 280ms passes your 300ms absolute threshold. But if it was 210ms three nights ago, 245ms two nights ago, and 280ms last night, you have a regression trajectory that will breach your SLA within a week. Absolute thresholds catch cliff-edge failures. Trend analysis catches the slow degradation that absolute thresholds miss entirely. Configure your nightly gate to flag any p95 degradation exceeding 10% relative to the previous 7-day rolling average – even when the absolute threshold still passes.
This is the concept of performance budgets: pre-defined per-journey thresholds that function as an early warning system, not just a binary pass/fail gate.
Stages 4 & 5 — Pre-Release Stress Testing and Production Synthetic Monitoring
Pre-release stress testing validates behavior at 150–200% of expected peak load. The goal isn’t to prove the system handles double the traffic flawlessly – it’s to verify graceful degradation. Under 150% of peak load, the system should return HTTP 503 with a Retry-After header within 2,000ms – not hang indefinitely, return corrupt data, or crash the database connection pool.
Production synthetic monitoring completes the continuous performance loop. Lightweight probes execute critical user journeys (login, search, checkout) every 5 minutes against production endpoints, tracking p95 response time and availability percentage. Think of production synthetic probes as a night watchman who checks every door every 5 minutes, they won’t prevent every incident, but they ensure you know within minutes, not hours, when post-deployment regressions or infrastructure drift degrade user experience.
RadView’s platform supports cloud-based load generation from geographically distributed nodes, enabling production synthetic probes that simulate real user traffic patterns from multiple regions – without requiring on-premises load generator infrastructure at each location.
Configuring Pass/Fail Gates: How to Make Performance Tests Actually Stop a Bad Release
Most teams that claim they do performance testing in their pipeline actually mean they run performance tests and then manually review results when convenient. That’s not a pipeline gate – that’s a pipeline decoration.
A real gate has three components: a threshold definition, an automated evaluation mechanism, and a pipeline-stopping action on breach. Here’s a concrete threshold configuration:
{
  "absolute": {
    "p95_ms": 500,
    "p99_ms": 2000,
    "error_rate_pct": 1.0
  },
  "regression": {
    "p95_delta_pct": 15,
    "throughput_delta_pct": -10
  }
}
This file is read by the test runner at execution time. If any absolute threshold is breached or any regression delta exceeds the configured limit relative to the previous baseline, the runner exits with a non-zero code, and the pipeline fails.
Calculating your baseline: Run the test 5 times under identical conditions. Take the p95 of the p95 values across those runs as your baseline. Set your absolute gate at baseline + 15%. This accounts for normal variance while catching genuine regressions. Store the baseline in your repository and update it quarterly – or whenever a major architecture change is deployed.
DORA research consistently finds that teams with automated test suites that enforce quality gates deploy more frequently and with lower change failure rates [2]. The gate is the mechanism that converts test data into delivery confidence.
Defining Your Threshold Hierarchy: Absolute Limits vs. Regression Deltas
A two-layer threshold model prevents both catastrophic failures and gradual degradation:
- Absolute limits define the hard ceiling, conditions that must never be breached regardless of trend. Example: p99 must never exceed 2,000ms; error rate must never exceed 1.0%.
- Regression deltas define the acceptable rate of change between runs. Example: p95 must not degrade by more than 15% vs. the previous passing run; throughput must not drop by more than 10%.
The failure mode of absolute-only thresholds is subtle but dangerous. If your absolute limit is 500ms and your application routinely runs at 200ms, a regression to 450ms passes the gate, even though performance has degraded by 125% and you’re one more regression away from breaching the SLA. Regression deltas catch this trajectory while absolute thresholds remain the safety net.
For the process rigor behind threshold methodology, Carnegie Mellon SEI Software Engineering Research & Best Practices provides extensive guidance on evidence-based software quality frameworks.
Integrating Threshold Gates into Jenkins, GitHub Actions, and Azure DevOps
Here are two ready-to-adapt integration patterns:
GitHub Actions:
steps:
  - name: Run Load Test
    run: |
      wlrun -t tests/performance/nightly_load.wlp \
             -config tests/performance/thresholds.json \
             -r results/
  - name: Upload Results on Failure
    if: failure()
    uses: actions/upload-artifact@v4
    with:
      name: perf-test-results
      path: results/
Jenkinsfile (Declarative):
stage('Performance Gate') {
    steps {
        sh '''
            wlrun -t tests/performance/nightly_load.wlp \
                  -config tests/performance/thresholds.json \
                  -r results/
        '''
    }
    post {
        failure {
            archiveArtifacts artifacts: 'results/**'
            slackSend channel: '#perf-alerts', message: "Performance gate failed on build ${BUILD_NUMBER}"
        }
    }
}
A critical pitfall: teams often append || true to the CLI invocation during initial integration to prevent pipeline failures while they’re calibrating thresholds. Then they forget to remove it, and the performance gate is permanently disabled. Instead, use an environment variable flag (PERF_GATE_ENABLED=false) that you can toggle without modifying pipeline code, and set a calendar reminder to flip it to true within two weeks.
WebLOAD by RadView: Built for Pipeline-Native Performance Testing at Enterprise Scale
The pipeline integration patterns described above require specific tooling capabilities: CLI-driven execution, threshold-based exit codes, scriptable test scenarios, and hybrid infrastructure support. WebLOAD was built around these requirements, backed by over 25 years of enterprise performance testing platform development.
JavaScript Scripting and CLI Integration: Developer-Friendly by Design

WebLOAD’s JavaScript-based scripting engine means performance tests are written in the same language many development teams already use. Tests live in tests/performance/ in the same repository as the application code, reviewed in the same PR, versioned in the same history, executed by the same pipeline.
A simplified WebLOAD script for a checkout flow:
// checkout_load_test.js
wlHttp.Get("https://api.example.com/products?category=electronics");
Sleep(2000); // 2-second think time simulating user browse behavior

wlHttp.Post("https://api.example.com/cart/add",
    {"productId": "${PRODUCT_ID}", "quantity": 1});
Sleep(1500);

wlHttp.Post("https://api.example.com/checkout",
    {"cartId": "${CART_ID}", "paymentToken": "${TOKEN}"});

// Verify response time SLA
if (wlHttp.LastResponse.Time > 500) {
    ErrorMessage("Checkout response time exceeded 500ms SLA");
}
The corresponding CLI invocation: wlrun -t checkout_load_test.wlp -vu 200 -duration 30m -threshold p95=300 – where -vu sets virtual users, -duration sets the test window, and -threshold defines the pass/fail gate.
The IDE also provides visual script recording as a starting point, record a browser session, then extend the generated script programmatically. This lowers the barrier for teams without dedicated performance engineering headcount, enabling developers to own performance test maintenance as part of their regular workflow.
Cloud and On-Premises Hybrid Load Generation: Test Where Your Users Are
A financial services firm running a customer portal on AWS and an internal trading platform on-premises needs to load-test both environments from a unified controller, without exposing internal infrastructure to external load generators. SaaS-only load generation tools require all target systems to be publicly accessible, which is a non-starter for regulated industries with strict network segmentation.
WebLOAD’s hybrid architecture runs cloud-based load generators for internet-facing applications while maintaining on-premises load generators behind the firewall for internal systems, all coordinated from a single test controller. Each load generator node supports thousands of concurrent virtual users, enabling teams to scale from integration-stage tests (200 VUs) to pre-release stress tests (tens of thousands of VUs) without re-architecting their test infrastructure.
For the security context around network segmentation in DevOps pipelines, NIST Guidelines for Secure and Reliable DevOps Pipeline Practices provides the relevant federal standards.
Frequently Asked Questions
Q: Should we run performance tests in staging or in a dedicated performance environment?
Neither option is universally correct. Staging environments often share infrastructure with other testing activities, introducing noise. Dedicated performance environments provide cleaner baselines but add infrastructure cost and drift risk (they fall out of sync with production). The pragmatic answer: run PR-gate smoke tests in ephemeral environments (spun up per PR), nightly load tests in a dedicated, production-equivalent environment that’s automatically provisioned via infrastructure-as-code and torn down after results are collected. This balances cost against signal quality.
Q: Is 100% load test coverage of all endpoints worth the investment?
Not always. Applying the Pareto principle is more cost-effective: identify the 15–20% of endpoints that handle 80% of traffic or revenue-critical transactions, and instrument those thoroughly. Coverage of long-tail endpoints should be proportional to their business impact. A 500-endpoint microservices application doesn’t need 500 individual load test scenarios, it needs 30–50 well-designed scenarios that exercise the critical paths and their downstream dependencies under realistic concurrency.
Q: How do we prevent performance test environments from drifting out of sync with production?
Use infrastructure-as-code (Terraform, Pulumi, CloudFormation) to provision your performance test environment from the same templates as production, ideally as a scheduled nightly job that tears down and rebuilds the environment before the load test run begins. Track environment configuration as a version-controlled artifact. When drift is detected (e.g., production scales to 4 database replicas but the perf environment still has 2), the pipeline should flag it as a test environment health check failure before executing any load tests.

Q: What’s the minimum team investment to implement pipeline-native performance testing?
For a team starting from zero, expect 2–3 sprints to reach Stage 1 (PR-gate smoke tests) and Stage 3 (nightly load tests) maturity. Sprint 1: select tooling, write 3–5 smoke test scripts for critical endpoints, configure the PR-gate pipeline step. Sprint 2: build the nightly load test suite covering core user journeys, configure threshold gates and trend tracking. Sprint 3: calibrate baselines, resolve false positives, and train the team on result interpretation. Pre-release stress testing and production synthetic monitoring (Stages 4–5) typically follow 1–2 months later as the team builds confidence.
Disclaimer: Results-based claims (e.g., latency improvements, deployment frequency gains) should be contextualized to specific test environments and configurations. Readers should validate pipeline configuration examples against their own CI/CD tool versions, as syntax and plugin APIs change across releases. WebLOAD feature references should link to current RadView product documentation to ensure accuracy.
References and Authoritative Sources
- DORA. (2025). Capabilities: Test Automation. DORA Core Model, Google. Retrieved from https://dora.dev/capabilities/test-automation/
- DORA. (2025). Capabilities: Continuous Delivery. DORA Core Model, Google. Retrieved from https://dora.dev/capabilities/continuous-delivery/
- Hughes, L.A. & Jackson, V.B. (2021). A Framework for DevSecOps Evolution and Achieving Continuous-Integration/Continuous-Delivery (CI/CD) Capabilities. Carnegie Mellon University Software Engineering Institute. DOI: https://doi.org/10.1184/R1/13954388.v1. Retrieved from https://www.sei.cmu.edu/blog/a-framework-for-devsecops-evolution-and-achieving-continuous-integrationcontinuous-delivery-cicd-capabilities/


