The continuous technological advancements in various industries have led to an increased reliance on digital tools and platforms to streamline various tasks. And for businesses, this means a possibility of expanded user traffic at any given time. This led to the further growth of the load testing industry, helping companies determine if their systems can handle a particular load. The sector is already valued at over $1 billion and is expected to grow more in the coming years.
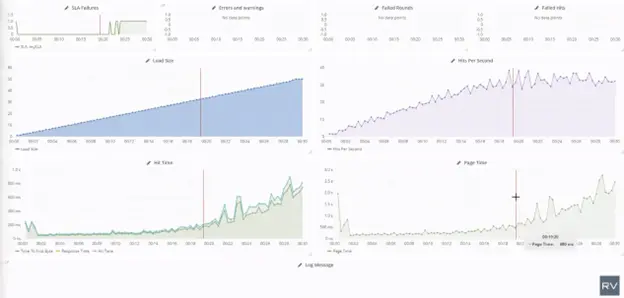
But despite its benefits, the complex nature of load testing can be intimidating for numerous enterprises. Load tests require the management of different parameters and understanding several graphs that can help illustrate how websites and applications perform under specific loads. This can be challenging for many performance engineers, especially those without extensive experience with load tests.
To help solve the complexity of load test results, we at Radview have constantly worked to innovate our flagship product to provide a more efficient system testing tool for our clients. We understand the need to simplify the interpretation of test results which can help engineers save time and resources. The latest version of WebLOAD saw the integration of a popular AI tool, making interpretation faster and more precise for performance engineers.
WebLOAD 13.0: Transforming the Load Testing Landscape
One of the most common issues regarding load testing is the intricacy of test results, often presented in graphs or charts. And for those new in load testing, this can lead to misinterpretation of the results, resulting in diminished system performance, website or application crashes, and negative user experience.
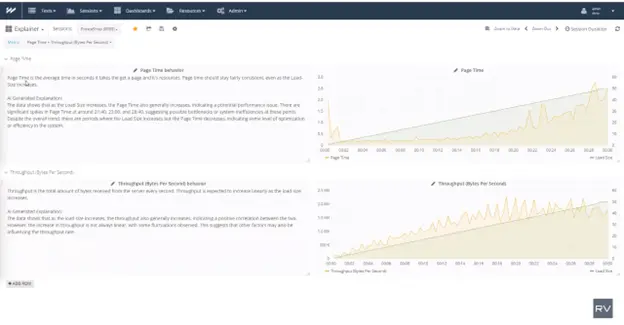
This is where the arrival of the new AI-powered Explainer panel comes into play. As the name suggests, the latest version of WebLOAD will have a tool that helps explain and simplify the data gathered from different sets of metrics after the tests. This is made possible with ChatGPT, assisting users to understand the meaning of the data effectively.
The Explainer panel of WebLOAD pioneers the adoption of AI tools into load-testing solutions, helping make the process more efficient for many. With the new version, even non-experts in load testing can quickly interpret data, ensuring they would not miss any detail to prepare their systems for peak user traffic.
The Role of ChatGPT
ChatGPT too the world by storm in late 2022 thanks to its capability to provide human-like conversations to its users. This software by OpenAI, an artificial intelligence research organization based in California, is a chatbot made with the company’s GPT (Generative Pre-training Transformed) AI language model, allowing it to give versatile and intelligent answers to inquiries.
Since its inception, ChatGPT has been used by millions for various tasks. Countless companies have used it to draft emails and marketing materials and generate leads. Meanwhile, many individuals use the platform to create codes, compose essays, develop art prompts, or even solve mathematical equations.
The ability of ChatGPT to provide human-like conversations and explanations makes integrating it into WebLOAD a no-brainer. ChatGPT can give a precise analysis of graphs and data during and after load tests, ensuring that no information in the test results will be overlooked, which can affect the system’s performance once it is live.
How to Activate the Explainer Panel
Setting up the new version of WebLOAD is straightforward, allowing you to activate the new feature in no time.
- The first thing to do is to create an account with OpenAI. Click the “Sign up” button on the top right corner of the homepage to be redirected to the account creation page. Once you create an account, you will have three options to choose from; click on the “API” option.
- When you’re already in the OpenAI platform, click “Personal” on the top right corner and select “View API Keys” from the drop-down menu. Here, you will be asked to create a new secret key that you will need later.
- Once you already have a secret key, you can now create a new text document in this exact location and file name:
C:\ProgramData\RadView\WebLOAD\explainer_settings.json
(“C:\ProgramData\RadView\WebLOAD” is the exact location where the new file should be created and “explainer_settings.json” is the file name)
- Inside the text document, enter your OpenAI token (the secret key) in a JSON (JavaScript Object Notation) format (see example below).
{

“openAIToken”   :   “sk-xxxxxxxxxxx”

}
- Once you’re done, the Explainer dashboard is available in the WebLOAD dashboard. And to make the Explainer panel more customized, there are also some advanced settings that you can include in the text document that allows you more control over the integration (see example below).
{

“openAIToken”   :   “sk-xxxxxxxxxxx”,	The OpenAI token which is always required

“model”   :   “gpt-4”,                                                	The model to be used to generate responses

“maxTokens”   :   256,	The maximum tokens (words) to be used in the response

“temperature”   :   0.0,	Randomness of the Response

“showExplanation”   :   true,	Whether to show static explanation or not

“loadSizeRequired”   :   true,	Whether the load size metric should be used

“includeTime”   :   true,	Whether time-related information is included

“explainRunningSession”   :   false,	Whether running sessions is explainer or not

“timeoutSeconds”   :   30.	Timeout duration for API requests

}
Sample Inputs and Outputs
As stated over and over again, load test results include several graphs that represent different metrics. And for those with little to no experience in load testing, this can be pretty confusing, often leading to miscalculated conclusions that can affect the website or application’s performance under heavy load.
The development of the Explainer panel gives performance engineers a handy tool that they can use to understand what the graphs imply clearly. This can prevent any potential false assumptions about the test results, which can hinder the development of the system. The Explainer dashboard can explain the test results, allowing load testers to assess whether performance issues are noticed during the testing.
When the Explainer panel is used, the graphs will be sent to ChatGPT to ask for its interpretation of the data. The AI tool will then send over a static definition of the metrics and an AI-generated explanation of the graph. It will suggest potential bottlenecks in the system based on the test results and even possible solutions to the issues.
Conclusion
The continuous growth of the digital sphere is why we at Radview are committed to providing our clients with a reliable and efficient load-testing tool. We understand the complexity of load tests, and our goal is to simplify load testing for performance engineers. By integrating ChatGPT into WebLOAD, we can now give our clients a load-testing tool that can streamline test results and provide an accurate explanation of what the graphs imply, reducing the possibility of human errors during interpretation.
So, if you want to try the latest WebLOAD version for your system, connect with us today by visiting www.radview.com/schedule-demo.


