Performance Testing Data Drilling – Introduction
The complexity of load testing has been challenging for many non-expert performance engineers for years. The multifaceted nature of load tests requires a comprehensive skill set and hands-on experience to identify issues in the system successfully. With a lack of deep understanding of the system’s architecture, network, and configurations, performance engineers might misinterpret the results, which can lead to suboptimal fixes or optimization.
This is where using top-notch performance testing solutions like WebLOAD comes in. The leading load testing tool has elements that can help engineers fine-tune their systems for optimal performance. One of these is Data Drilling, a feature in WebLOAD Console that provides low-level performance data similar to raw data. But unlike raw data presented in charts, lines, and dots on a cartesian plane, data drilling offers the necessary information in tables.
How to Configure Data Drilling in WebLOAD
Setting up data drilling in the WebLOAD Console is straightforward and only takes a few steps. To start, open a new simple template with one script. Once the template is open, click “Tools” and select “Current Session Options.” After this, find the “Functional Testing” tab and note the “Automatic data collection” box.

In the red box shown in the image above, make sure to select “All pages,” “Object level,” and “HTTP level.” You can then run the script with one user long enough to complete a few rounds. It should be noted that data drilling information is unavailable while the test is being executed.
What to See in the Data Drilling Feature
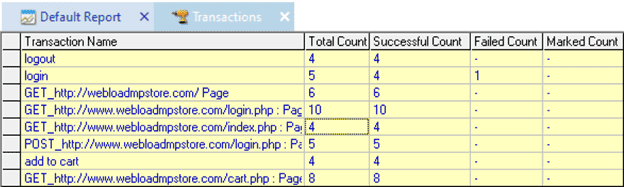
There are several things performance engineers can check when the data drilling feature is configured correctly. And to access this, engineers can click on the “Open Data Drilling” menu item (see icon below). Once this is clicked, a screen with several tabs, including a “Transactions” tab, will pop up.
![]()

Checking the boxes on the “Functional testing” tab tells the WebLOAD load generator to make every page request in the script to be a transaction named “GET_”-URL or “POST_”-URL. But apart from these, the transactions the engineers created are also there. Each row also shows the “total count,” “successful count,” and “failed count” for each page or transaction.
When the landing page is identified, double-click on its line in the table to get something like the image below. This tab is labeled the same as the transaction double-clicked on the previous tab and can be called the “Hit list.” And in this example, it is notable that the duration all fit within a thirty-three-millisecond range.

Here are the different columns in this tab:
● Time – the number of seconds since the beginning of the test.
● Duration – the number of seconds to process that complete page – top-level hits and all resource hits.
● Total Load Size – the number of running virtual users at this point.
● Thread Number – the same as the virtual client number.
● Round Number – the round number for this page hit.
● Load Generator – the component responsible for generating virtual users or load on the tested system.
Performance engineers can inspect the first-page request by double-clicking on the gray box at the left end of the first line. This will open another tab showing all the details about the request.

To further investigate, right-click on the green icon at the left side of the URL (pointed by the yellow arrow on the image above) and select “Zoom out.”

This will open up a collapsed tree structure that contains data that can be valuable in pinpointing the bottlenecks in the system. The “Http sub transactions” drop-down can be expanded to reveal information about the top-level hit, while the “Objects” option has the list of resource files.
In the image above, note that “Objects” is selected and look at the property or value window. Time is when WebLOAD started to fetch the objects, and duration is how long it took the console to fetch them.
Meanwhile, in the image below, note that the “Http sub transactions” is highlighted. The “time” (2.134 seconds) is when WebLOAD started to process the top-level hit, and the “duration” is how long it took WebLOAD to process the top-level hit (0.255 seconds).

If the engineers click “Open connection,” it will show a duration. In this case, the “duration” is fifty milliseconds, while “send” took one millisecond. “Time to first byte” took 152 milliseconds, and “receive” took 52 milliseconds. If you expand one of the resource files under Objects, you will see a child called “Http sub transactions” with “open connection,” “Send,” “Time to first byte,” and “receive.”
How Can this Data Be Used?
The information performance engineers can get from data drilling can help when they notice a large maximum page time, which indicates that a web page is experiencing significant delays. The engineer can access the “Hit list” and find detailed information about every HTTP request during the test.
They can then look for the problematic page by searching for the entry with a significantly longer duration than the others. Once found, the engineers can start diagnosing and optimizing the issue, whether because of slow server responses, large file sizes, or inefficient scripts.
Performance Testing Data Drilling – How it can help Non-Experts testers
The data drilling feature of WebLOAD is invaluable in the modern load testing landscape. This enables non-experts to have a reliable tool to help identify specific system issues. With precise numbers on hand, the information from data drilling will help locate problematic URLs and prevent substandard optimization of these pages.
So, if you want to leverage data drilling for performance testing, schedule a WebLOAD demo today.
Read More: 4 Ideas for Getting Started with DevOps Performance Testing


