
In the previous posts “SLA and it’s connection to Load Testing” and “Defining rules easily using WebLOAD’s “SLA Manager” we described what is SLA, and how to define rules.
This post will focus on the enhanced combination of SLA definition – the combination between client and server measurements in SLA.
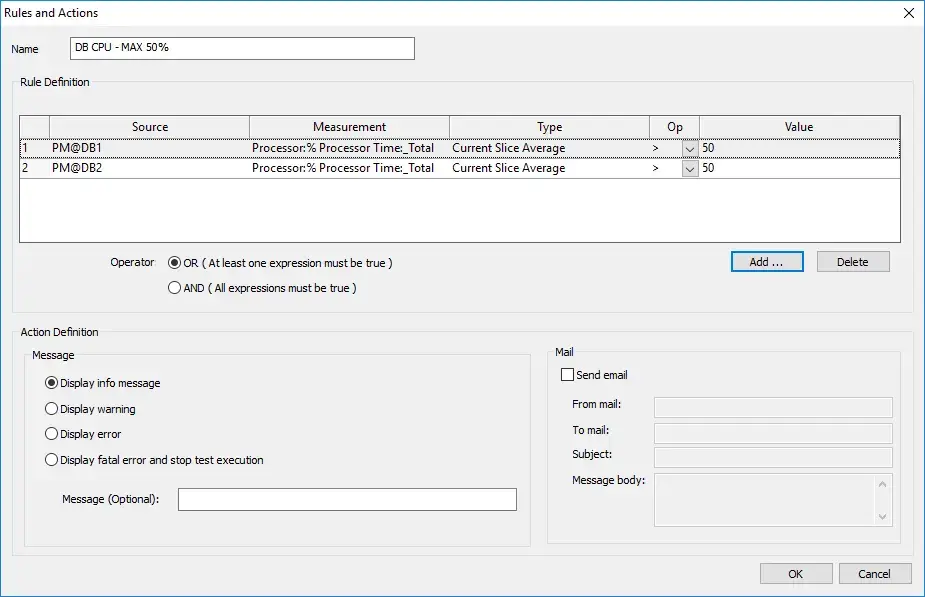
In this simple example, an application with 2 DB servers that both should not reach 50% CPU with any load size. In this case the conditions are:
- DB1 cpu > 50
OR
- DB2 cpu > 50
If one of the conditions is met, an SLA Alert will be sent
The above is a simplified example, to this example can be added memory consumption limitation, disk caching, IO, or any other performance measurement collected throughout a test.
WebLOAD allows to define SLA rules with ANY measurement – server side or client side.
In another example, server measurement and client measurements are combined into one rule. These alerts are more powerful and provide much more information to the user.
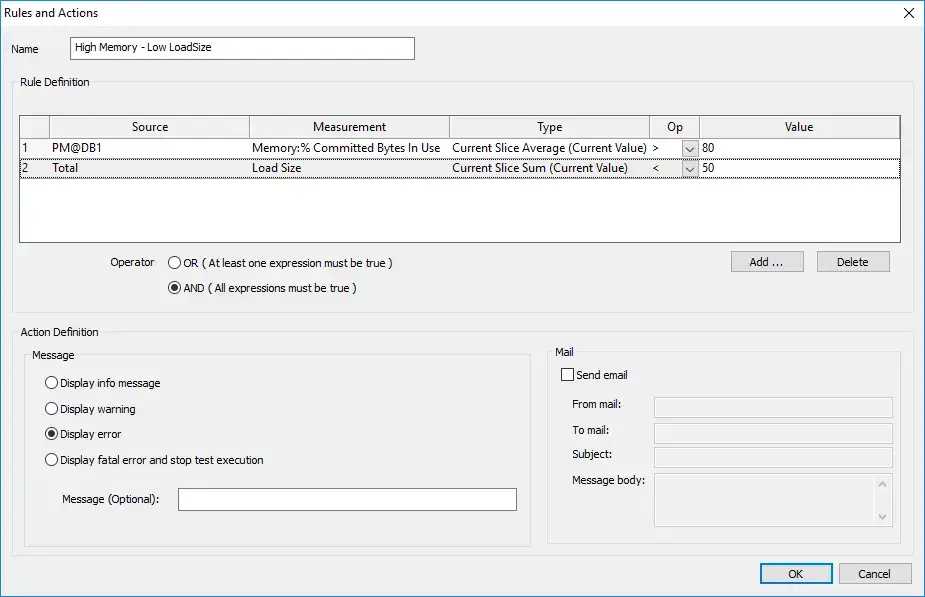
Microsoft recommends that the “Memory\% Committed Bytes in Use” indicates low memory when it is above 80%. It’s not expected to be that high when the load size is very low. If that happens a red flag should be raised.
In this case the conditions are:
- Memory\% Committed Bytes in Use > 80
AND
- Load size < 50
If both conditions are met, an SLA Alert will be sent.
In this third example, high transaction time and high server CPU is normal as it suggests that the server is busy. If in such situation the server CPU is low it may suggest significant problems such as locking or concurrency issue – When defining the SLA rules in a creative way, a big variety of problems can be detected.
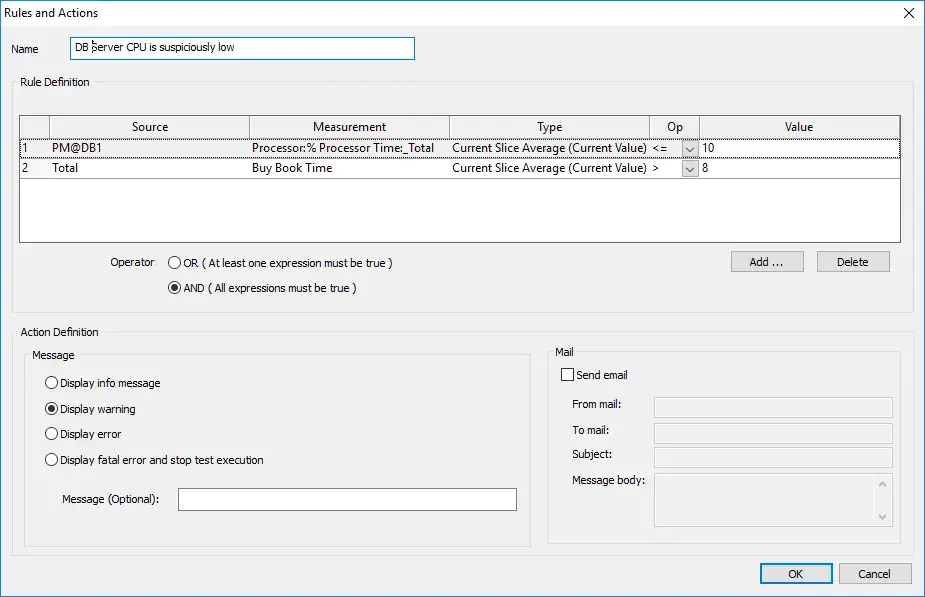
A performance engineer knows the system behavior and can define limits that raises red flags for future executions.
To learn more about WebLOAD’s abilities, schedule a demo with us.


