Giving internet users an optimized website has become paramount in the modern business landscape, pivotal in running a successful business in many industries. Nowadays, Raw data performance testing is a process companies must embrace and implement, offering digital consumers an intuitive and efficient platform to shop for goods and services and conduct other transactions. With a fully optimized website, businesses can build connections with their customers and prevent them from abandoning the session.
However, several factors can affect a website’s performance, which can cause slow loading of pages. Server overloads, dependency on third-party APIs, ineffective caching, and complex page elements can result in poor performance and negative user experiences.
This can also lead to performance engineers questioning their systems, sending support cases saying, “My average page time is great, but my users complain of occasional poor response times. What is going on?” or “I have one complex page that regularly runs slowly, which URL in that page is the problem?”
This is why raw data performance testing is a crucial process, giving performance engineers a valuable tool for identifying issues in the system. Raw data can make a difference in performance testing, allowing engineers to solve problems that usually cause users to migrate to competitors’ pages.
Understanding Raw Data
Raw data refers to the detailed and individual records or entries generated and stored in a database for every event or action during testing. This is crucial for performance engineers who must pinpoint precisely which transactions are causing the problem. In addition, it can also help engineers understand how performance degrades under high loads, as they have the data for each event.
Some of the usual events that are recorded into the database when raw data is being collected include:
- Alert– The notifications or warnings a performance testing tool generates when certain predefined conditions are met.
- DNS Lookup– One crucial factor that affects website load times is DNS Lookup, and it is essential to monitor this to determine any delays in the DNS resolution process.
- Hit– This represents a single HTTP request to a web server, including requests for web pages, images, and scripts.
- Page – This refers to loading a complete web page and encompasses multiple hits and resource requests. “Page” events can help measure the time needed to load and render web pages.
- Round– This usually represents a single iteration of a test scenario or script where a group of virtual users simulates interactions in a website, helping evaluate how the system works in concurrent loads.
- Transaction – A series of actions a user takes while on the website, which usually involves signing in to complete a purchase.
Collecting Raw Data in WebLOAD
Standard WebLOAD data collection aggregates data about hits, pages, rounds, and transactions on the load generator that computes the maximum value, minimum value, average, and standard deviation. This means the common load testing practice does not return a data row for each hit event but returns statistics.
But with WebLOAD’s Raw Data panel, the tool returns a data row for each hit, page, round, transaction, DNS lookup, and alert. This lets performance engineers look for poorly performing hits and understand if hit times get longer with a higher load.
Here are some examples to help performance engineers understand the benefits of using Raw Data in WebLOAD.
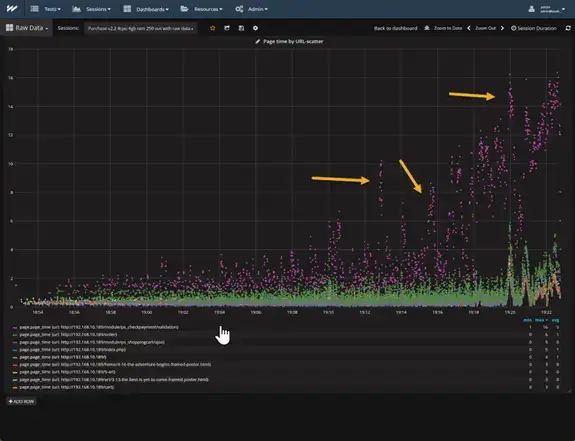
The image above shows a test that runs for 30 minutes with virtual users ramping up from 1 to 250. The very noticeable data from this is the purple dots, which indicate a problem. They start relatively small, but as we increase the number of virtual users, the trend line goes exponential, which is bad as this indicates a conflict.
The green dots also present an issue in the system, although not as bad as the web page represented by the purple dots. As shown in the “max time” column on the table below the graph, the largest value for the green dots representing the URL “/order” is only six seconds. Meanwhile, the URL “/module/ps_checkpayment/validation” has a value of sixteen seconds.
Apart from the maximum load time, some other issues can be gathered from this. For example, the vertical clusters of the purple dots (marked by the yellow arrows) indicate that the URL “/module/ps_checkpayment/validation” is using some resource that when one virtual user has it, other users must wait for it.
Here is another example:
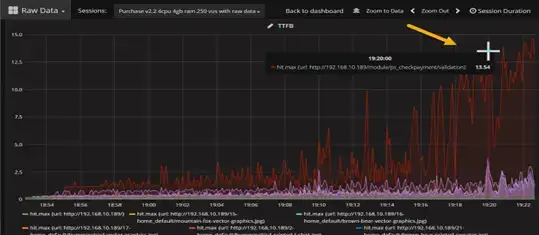
The image above shows a chart that presents the “Time to first byte” (TTFB) that measures the server time it takes to process a request. This chart plots all hits, 90th percentile, averaged over a five-second interval. The graph shows that TTFB looks great until 19:20 before throwing several spikes, which means some sort of limit is hit.
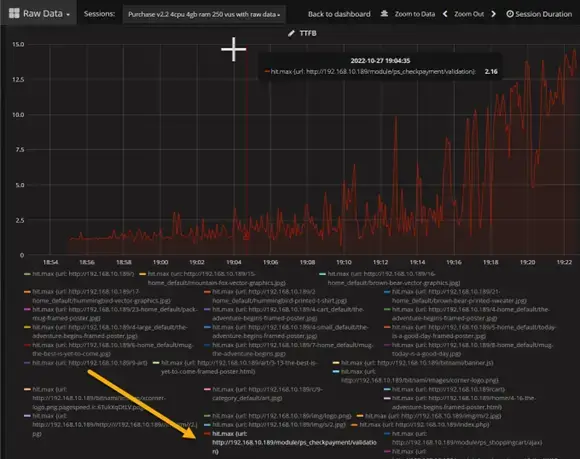
To determine which hit is the problem, engineers can make a chart showing TTFB with one line representing every URL. And to determine the URL that has the issue, just simply hover over the highest line.
Performance engineers can then look through the table of URLs below the chart and select the URL represented by the line. Once clicked, the other URLs disappear, and the engineer can then focus on the problem.
Engineers might probably know which transaction was the issue, but they may not have known which specific URL was the problem. This allows them to have numbers to justify working on that URL.
Here is another way raw data allows performance testers to be more effective in identifying issues in the system.
The transaction summary table in the image above shows one row per transaction and how it performs during the testing. The rows contain the transaction name, number of data samples, the average, 90th percentile, 95th percentile, 99th percentile, minimum value, and maximum value. These rows can be sorted based on what the engineers are checking.
Here is a similar table, which now shows one row per URL (hit). This table is sorted in descending order based on the average time. Note that the average time on the top row is 4.831 seconds, and a maximum load time of 14.592 seconds. Meanwhile, the second largest average is only half a second with a max of 3.75 seconds, which is smaller than the first row’s average. This indicates that the URL in row one is the problem.
Conclusion
As the need for a more practical approach in performance testing increases, utilizing raw data can be a game changer for many performance engineers. Raw data provides more information about issues in the system by pinpointing which URL is the problem, something that standard statistics cannot. It communicates visualization better, enabling engineers to mitigate missed interpretations and conclusions about the issue.
So, if you are ready to leverage the power of raw data for your system using WebLOAD, get a free live demo today by visiting our Demo page.


