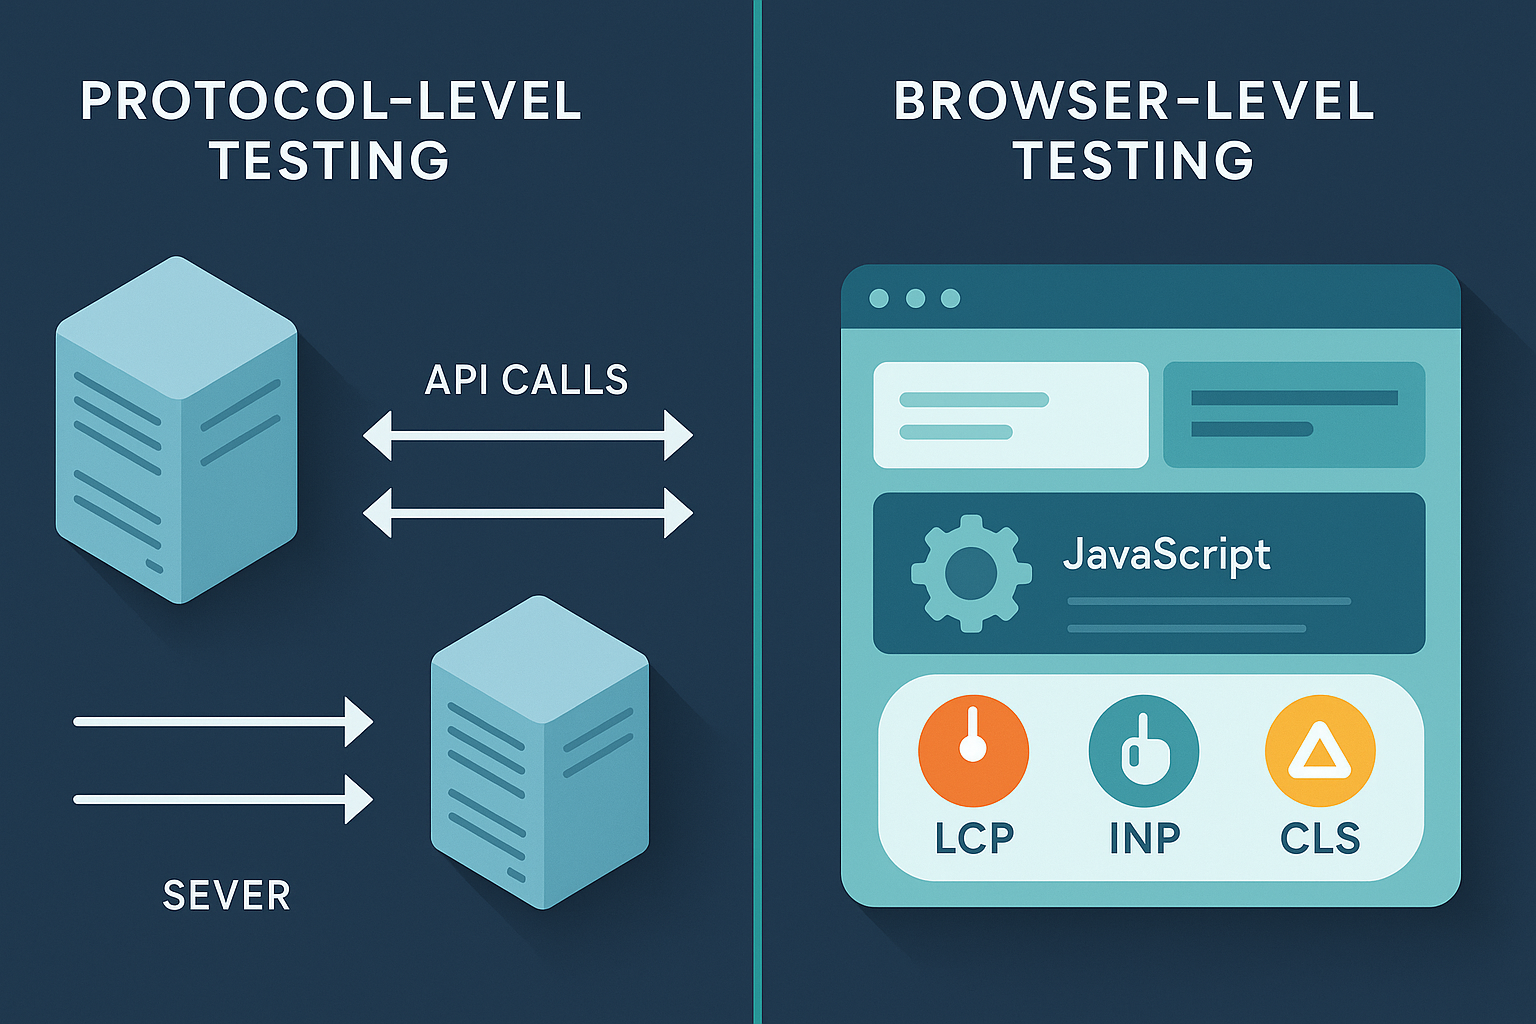
Your load tests pass. Your p95 server response time sits comfortably at 280ms. You ship on schedule. Then 4,000 concurrent users hit your single-page application on launch morning, and the support queue fills with complaints about frozen checkout flows and search results that take six seconds to render. The server metrics look fine – because the server was fine. The bottleneck was 1.2MB of unoptimized JavaScript executing on the main thread, a third-party payment widget blocking Largest Contentful Paint, and a React component tree re-rendering 600 DOM nodes on every cart update. Your protocol-level load scripts – which never opened a browser – had no way to see any of it.
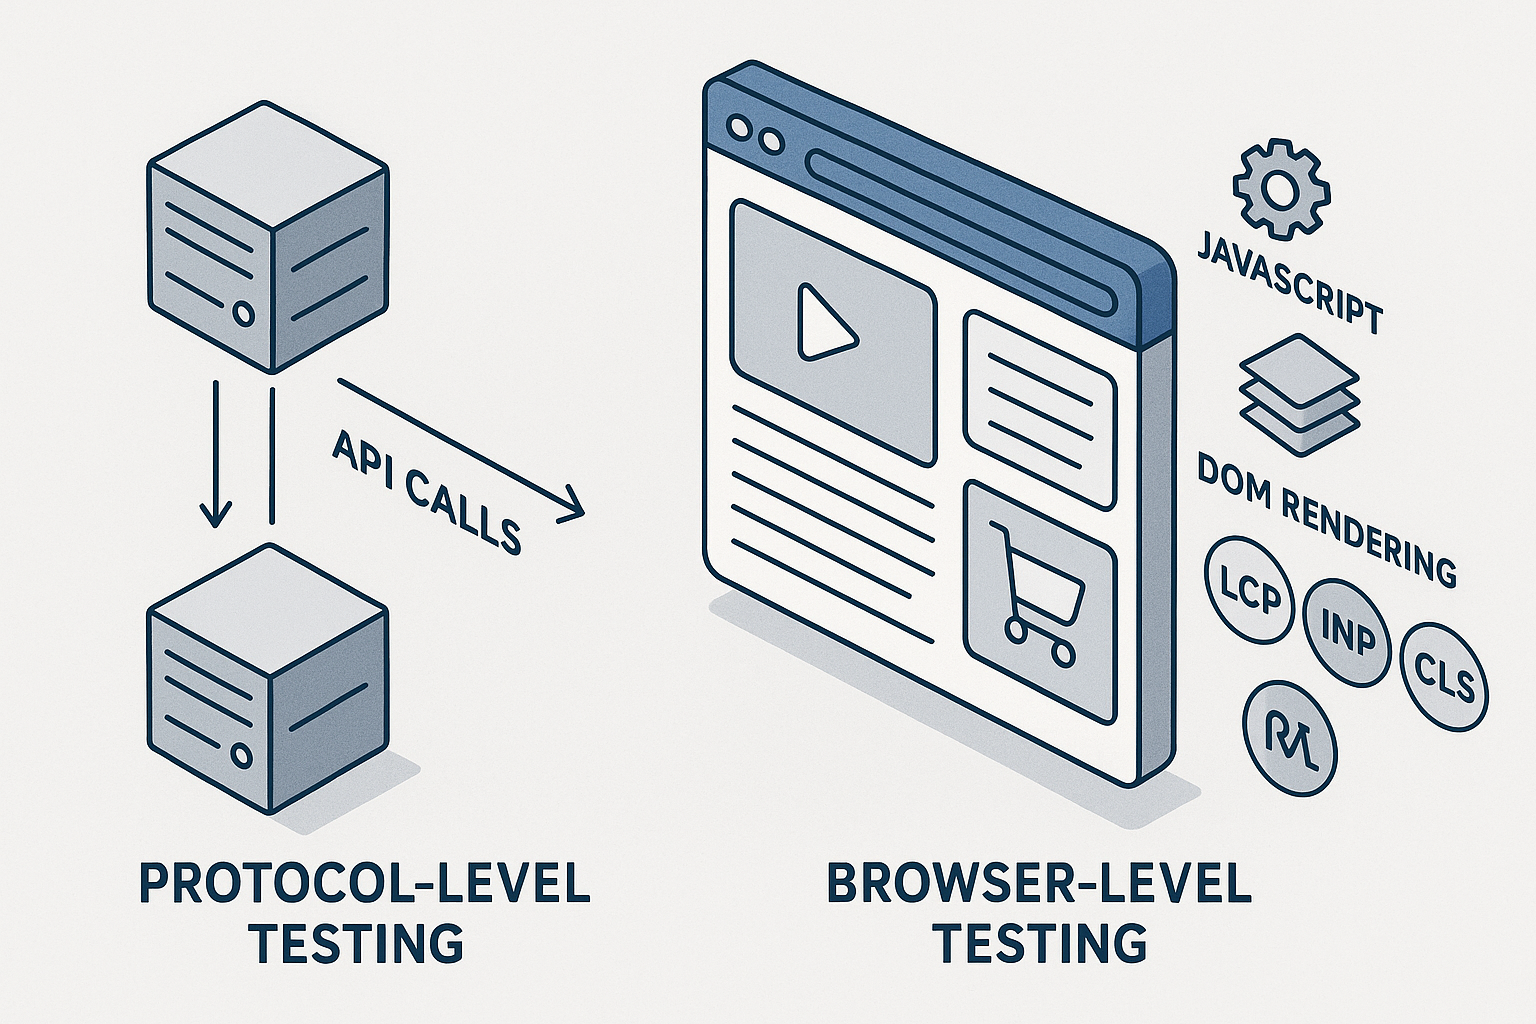
This is the testing fidelity gap. Protocol-level scripts measure how fast your servers respond. Browser performance testing measures what users actually experience: JavaScript execution delays, DOM rendering time, layout shifts, and the cumulative drag of third-party scripts. Both are necessary. Neither replaces the other.
This guide gives you the practitioner’s framework for closing that gap – from selecting the right browser-level metrics to extending your existing Selenium scripts into performance scenarios, to architecting hybrid load tests that deliver backend stress and frontend fidelity in a single test run.
- What Is Browser Performance Testing (And Why Your Load Tests Are Missing Half the Picture)
- Browser Performance Metrics That Actually Matter: From Core Web Vitals to JavaScript Execution Time
- Can Selenium Do Performance Testing? (The Honest Answer)
- The Hybrid Testing Architecture: Combining Protocol VUs and Browser VUs for Scale Without Compromise
- Common Browser Performance Bottlenecks – and How to Find Them Under Load
- Real-World Scenarios: What Browser Performance Testing Uncovers in E-Commerce, SaaS, and Financial Applications
- Implementing Browser Performance Testing with WebLOAD: A Setup Checklist
- Frequently Asked Questions: Browser Performance Testing
- References
What Is Browser Performance Testing (And Why Your Load Tests Are Missing Half the Picture)
Browser performance testing measures application behavior inside a real or emulated browser runtime – executing JavaScript, constructing the DOM, loading CSS and images, and timing the results against user-centric benchmarks. It captures what protocol-level HTTP scripts are architecturally incapable of reporting.
Consider a SPA route change: a user clicks “My Orders,” the application fires an XHR that returns in 45ms, and the protocol script records a near-instant HTTP 200. But inside the browser, that 200 response triggers a 400ms JavaScript bundle evaluation, a 150ms virtual DOM reconciliation, and a 90ms paint operation. The user waits 685ms – not 45ms. Protocol scripts report the 45ms and declare success. Browser tests report the 685ms and reveal the problem.
Philip Walton of Google’s Chrome team articulates why this distinction now has standards-level backing: “Core Web Vitals represent a distinct facet of the user experience, is measurable in the field, and reflects the real-world experience of a critical user-centric outcome”[1]. These metrics – LCP, INP, CLS – exist exclusively in the browser rendering pipeline defined by the W3C Navigation Timing Level 2 specification [2], which exposes timing attributes from domInteractive through loadEventEnd that protocol-level tools structurally cannot access.
Performance Engineer’s Insight: For any application where client-side rendering accounts for more than 30% of perceived load time – and that includes most modern SPAs, dashboards, and progressive web apps – protocol-only testing produces results that are technically accurate but experientially misleading.
For a foundational reference on browser performance concepts, the MDN Web Performance Documentation covers the rendering pipeline in detail.
Protocol-Level vs. Browser-Level Testing: A Clear Breakdown
These two approaches answer fundamentally different questions. Here’s the practical breakdown:
| Dimension | Protocol-Level Testing | Browser-Level Testing |
|---|---|---|
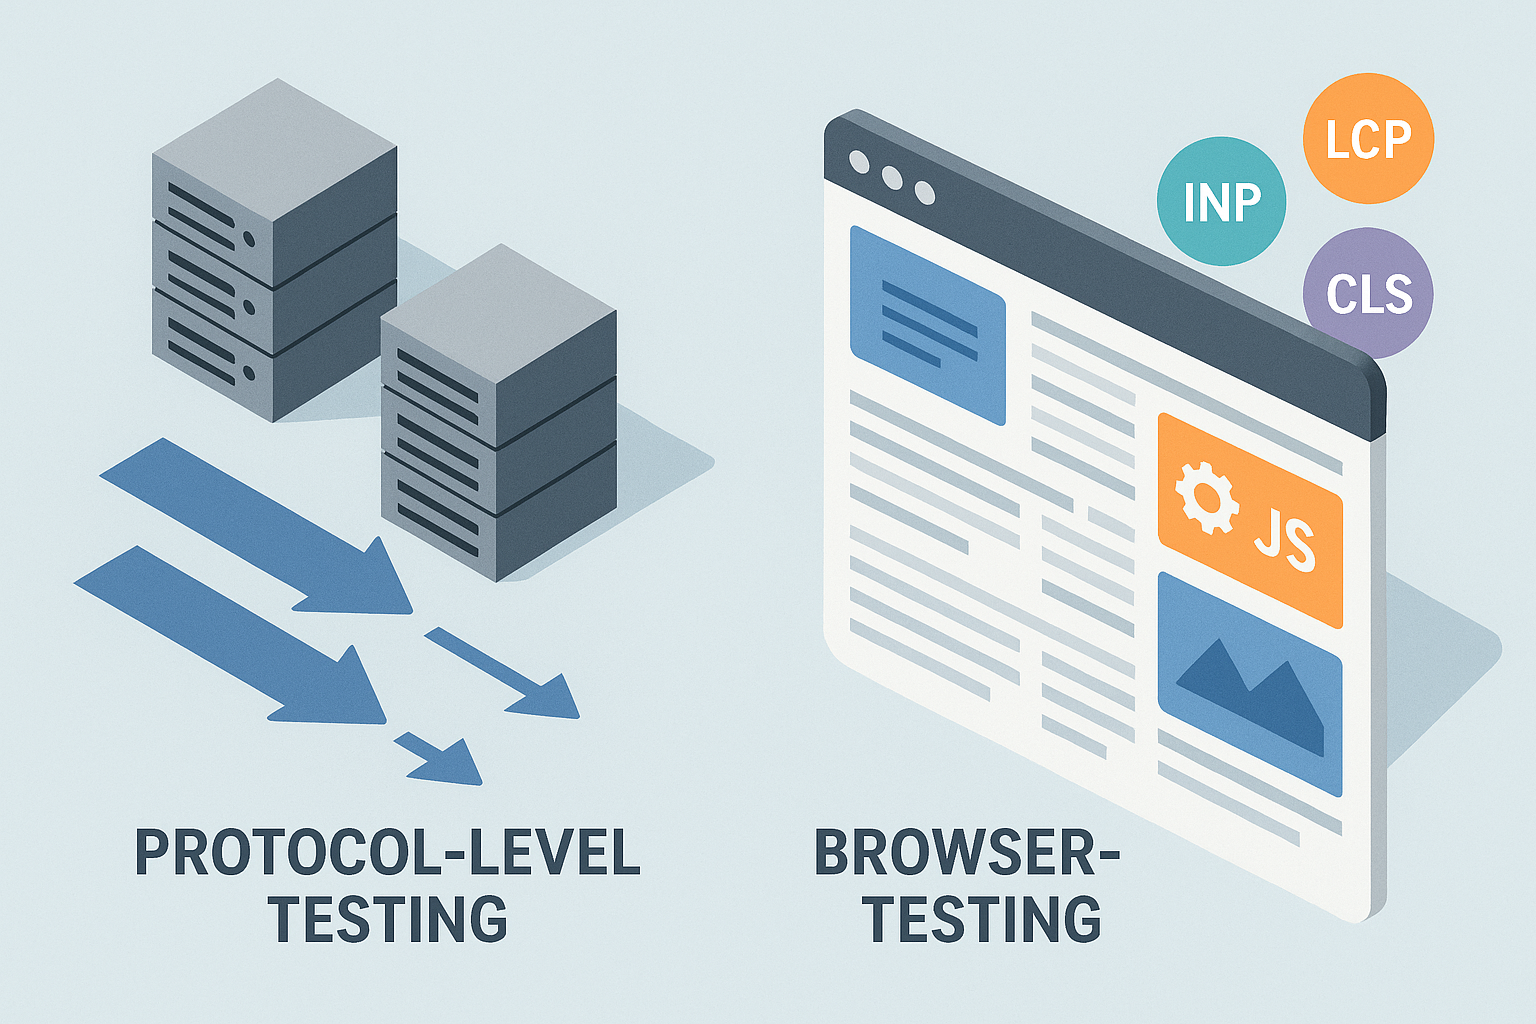
| What is measured | HTTP request/response cycles, server throughput, database query latency, API error rates | JavaScript execution time, DOM construction, resource rendering, Core Web Vitals (LCP, INP, CLS) |
| Resource cost per VU | Low (~1 – 5MB RAM per virtual user) | High (~250 – 500MB RAM per browser instance) |
| Best suited for | API stress testing, backend capacity planning, high-concurrency volume simulation | Client-side rendering validation, SPA performance, JavaScript-heavy apps, third-party script impact |
| Example metrics produced | Requests/sec, p95 response time, error %, TTFB (server-side) | domInteractive, domComplete, loadEventEnd, LCP, INP, CLS, JS execution time |
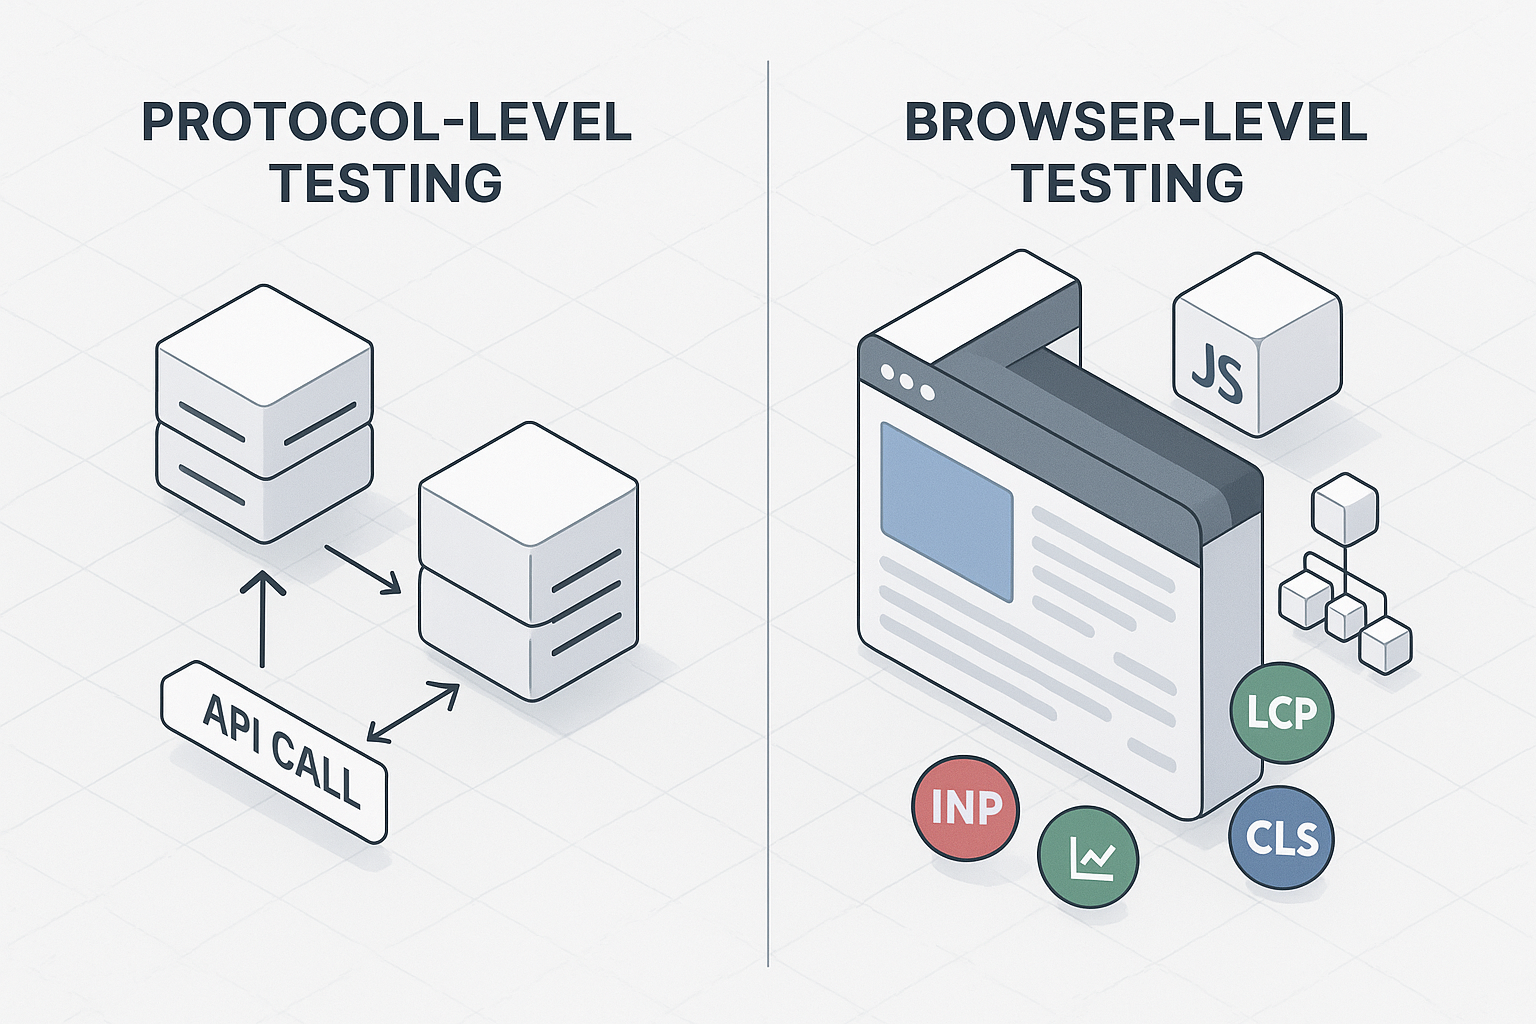
The W3C Navigation Timing Level 2 specification[2] defines timing attributes – domInteractive, domContentLoadedEventStart, domComplete, loadEventEnd – that represent the browser’s internal processing pipeline. These attributes are the data points browser-level tests expose and protocol scripts cannot. For a broader look at how these metrics fit into the different types of performance testing explained, understanding this distinction is essential.
When Browser-Level Testing Is Non-Negotiable: Use Cases
Three application architectures make browser testing mandatory, not optional:
React/Vue/Angular SPAs: Route transitions trigger full client-side rendering cycles. A protocol script sees an HTTP 200; the browser executes 300 – 800ms of JavaScript to hydrate the view. Time to Interactive goes unmeasured without a real browser.
Progressive Web Apps with service workers: Caching logic, offline fallback rendering, and background sync scripts execute entirely in the browser runtime. Protocol scripts bypass service workers completely.
Dashboards with WebSocket-driven data visualization: Chart libraries like D3 or Highcharts render client-side. A WebSocket message arrives in 12ms; the chart re-render takes 450ms. CLS violations from dynamically injected chart containers are invisible to HTTP-level tests.
The third-party exposure compounds all three: the HTTP Archive Web Almanac 2024 found that 92% of web pages include one or more third parties[3]. Every analytics tag, consent banner, and chat widget executes JavaScript in the browser – adding latency that only browser-level testing can measure. INP (Interaction to Next Paint), the Core Web Vital that replaced FID in March 2024, is measurable only during real browser interaction simulation[1].
For the full spectrum of user-centric metrics, see the Core Web Vitals Learning Resources (web.dev).
Real User Simulation vs. Synthetic Testing: What’s the Difference?
These terms get conflated constantly. Here’s the spectrum:
Synthetic protocol testing: Scripted HTTP requests in a controlled environment. No browser. Measures server behavior. A product search returns in 80ms – test passes.
Real user simulation: Full browser execution of scripted user journeys under controlled load conditions. The same product search triggers a 250ms client-side filter animation with a layout shift as results populate. The browser VU captures INP of 310ms and CLS of 0.18 – both violations. For more on designing these kinds of scenarios, see this guide on creating realistic load testing scenarios.
Real User Monitoring (RUM): Passive field data from actual production users. Accurate but retrospective – you discover problems after users experience them.
Real user simulation occupies the sweet spot: browser-environment realism with the repeatability and pre-production timing of synthetic testing. Walton’s guidance to measure at the 75th percentile of page loads[1] reinforces that simulation must model realistic conditions – slower devices, constrained networks – not just ideal-case lab environments.
Browser Performance Metrics That Actually Matter: From Core Web Vitals to JavaScript Execution Time
Before designing browser performance tests, you need a clear metrics framework. This section is your reference.
Core Web Vitals Explained: LCP, INP, and CLS for Performance Testers
Google’s Core Web Vitals[1] define three thresholds, measured at the 75th percentile:
LCP (Largest Contentful Paint) ≤ 2.5s: Measures when the largest visible content element finishes rendering. Under load, LCP degrades when image CDNs saturate, render-blocking CSS delays the critical path, or server TTFB increases. A browser-level load test with 200 concurrent VUs hitting a product listing page will surface LCP degradation that protocol scripts measuring only the API response cannot.
INP (Interaction to Next Paint) ≤ 200ms: Measures responsiveness to user interactions – clicks, taps, key presses. INP replaced FID in March 2024, capturing the full interaction lifecycle rather than just first input delay. For JavaScript-heavy applications, INP is the metric that exposes slow event handlers. A search filter that triggers a 350ms re-render fails INP even though the underlying API responded in 40ms.
CLS (Cumulative Layout Shift) ≤ 0.1: Measures visual stability. Dynamically injected content – ads, lazy-loaded images without dimension attributes, async-loaded components – causes layout shifts. An infinite scroll implementation that inserts DOM nodes above the viewport can push CLS above 0.25, destroying user trust in the interface.
The W3C Navigation Timing Pipeline: What Happens Between Click and Loaded
The W3C Navigation Timing Level 2 specification[2], edited by Yoav Weiss and Noam Rosenthal, defines the browser’s internal timing sequence:
navigationStart → DNS lookup → TCP connection → TTFB → domInteractive → domContentLoadedEventStart → domContentLoadedEventEnd → domComplete → loadEventEndThe specification states: “domInteractive – measured before the user agent sets the current document readiness to ‘interactive’”[2]. This is the moment the DOM is parsed and ready for JavaScript interaction, but external resources (images, stylesheets) may still be loading.
A domInteractive value exceeding 3 seconds under concurrent load strongly suggests render-blocking JavaScript – the parser is waiting for synchronous script execution before it can mark the document interactive. WebLOAD’s browser-driven VUs capture this full timing pipeline for every virtual user session, exposing exactly where in the sequence degradation occurs. For a deeper dive into which KPIs to prioritize at each stage, see the performance metrics that matter in performance engineering.
For the normative standard definitions, see the W3C Navigation Timing API Specification.
JavaScript Execution Time and Main Thread Blocking: The Hidden Metrics
Addy Osmani of Google defines the threshold precisely: “A Long Task is JavaScript code that monopolizes the main thread for extended periods of time, causing the UI to ‘freeze’ – CPU-heavy Long Tasks are caused by complex work that takes longer than 50ms”[4].
Under single-user conditions, a 200ms JavaScript evaluation during a form submission is noticeable but tolerable. Under load – 10 concurrent browser VUs each triggering that same 200ms evaluation while the server’s response time has climbed from 80ms to 350ms – the compound effect produces INP values exceeding 500ms. The UI becomes unresponsive. Users abandon the form.
Browser-level load testing surfaces this compounding effect because it runs the actual JavaScript in a real browser engine under realistic concurrency. Protocol scripts recording the server’s 350ms response time report a mild degradation; browser VUs report a user experience crisis.
For deeper coverage of main thread optimization, see the MDN Web Performance Documentation.
Can Selenium Do Performance Testing? (The Honest Answer)
Selenium was built for functional browser automation – verifying that elements render, buttons work, and workflows complete. The Official Selenium Test Practices Documentation makes this scope clear. Selenium controls one browser session at a time. It has no load orchestration, no concurrent virtual user management, no statistical aggregation across sessions, and no built-in network condition emulation.
But Selenium does something no protocol script can: it executes real JavaScript in a real browser engine, interacts with actual DOM elements, fires genuine browser events, and exposes the W3C Navigation Timing pipeline. That fidelity is irreplaceable.
The solution is embedding Selenium inside a platform that provides the scale, orchestration, and metrics aggregation it lacks on its own. WebLOAD does exactly this – importing Selenium scripts and executing them as browser-driven virtual users under load, with full metric collection across all concurrent sessions. For a detailed walkthrough of how QA teams are making this work in practice, see how QA teams extend Selenium for scalable load and functional testing.
Performance Engineer’s Insight: Teams maintaining separate Selenium scripts for functional QA and protocol scripts for load testing are doing double the maintenance work for half the insight. Embedding Selenium scripts inside a load platform collapses this into a single, reusable script asset that serves both purposes.
Converting Existing Selenium Scripts into Performance Scenarios
The conversion from functional script to performance scenario requires three targeted changes:
- Replace hard sleeps with measured waits. A functional script might use
time.sleep(3)to wait for a modal to appear. In a performance scenario, this becomes an explicit wait on element visibility –WebDriverWait(driver, 10).until(EC.visibility_of_element_located(...)). The explicit wait returns as soon as the element appears, and the elapsed time becomes a measured data point in the browser timing report. The hard sleep wastes 3 seconds regardless and poisons your timing data. - Parameterize user data. Hard-coded login credentials cause concurrent session conflicts – 50 browser VUs all authenticating as the same user triggers session invalidation cascading. Use data files or parameter generators to give each VU unique credentials and input data.
- Convert assertions to performance checkpoints. A functional
assert element.is_displayed()becomes a timing checkpoint: record the timestamp when the element becomes visible, compare it against your LCP or TTI threshold, and flag violations in the test report.
WebLOAD’s Selenium Integration in Practice: Step-by-Step Configuration
Setting up a browser-based load scenario in RadView’s platform follows a concrete workflow:
- Import the Selenium script into WebLOAD’s IDE. The JavaScript-native scripting engine executes Selenium scripts without requiring a separate WebDriver server process.
- Configure browser VU count – start with 5 – 10 for validation. Each browser VU instance requires approximately 250 – 500MB RAM depending on application complexity.
- Set ramp-up parameters – no faster than 1 new browser VU per 5 seconds to prevent test infrastructure saturation during initialization.
- Configure think time – 3 – 8 seconds between actions to simulate realistic user pacing, not robotic click-through behavior.
- Launch and monitor – the dashboard displays browser-specific metrics (DOM load time, JavaScript errors, resource waterfall timing) alongside standard throughput and response time data.
Common pitfall: Under-provisioning memory per browser instance. A load generator with 16GB RAM attempting to run 80 browser VUs will start swapping to disk, contaminating your timing data with infrastructure artifacts rather than application performance signals. Budget conservatively: 16GB supports approximately 16 – 32 browser VUs depending on page complexity.
The Hybrid Testing Architecture: Combining Protocol VUs and Browser VUs for Scale Without Compromise
The hybrid model resolves a genuine engineering dilemma. Browser VUs consume 250 – 500MB RAM each. Running 1,000 browser VUs would require a load generator fleet measured in terabytes. Protocol VUs consume 1 – 5MB each – you can run 10,000 on a single machine. But those 10,000 protocol VUs will never tell you whether the checkout page freezes under load.
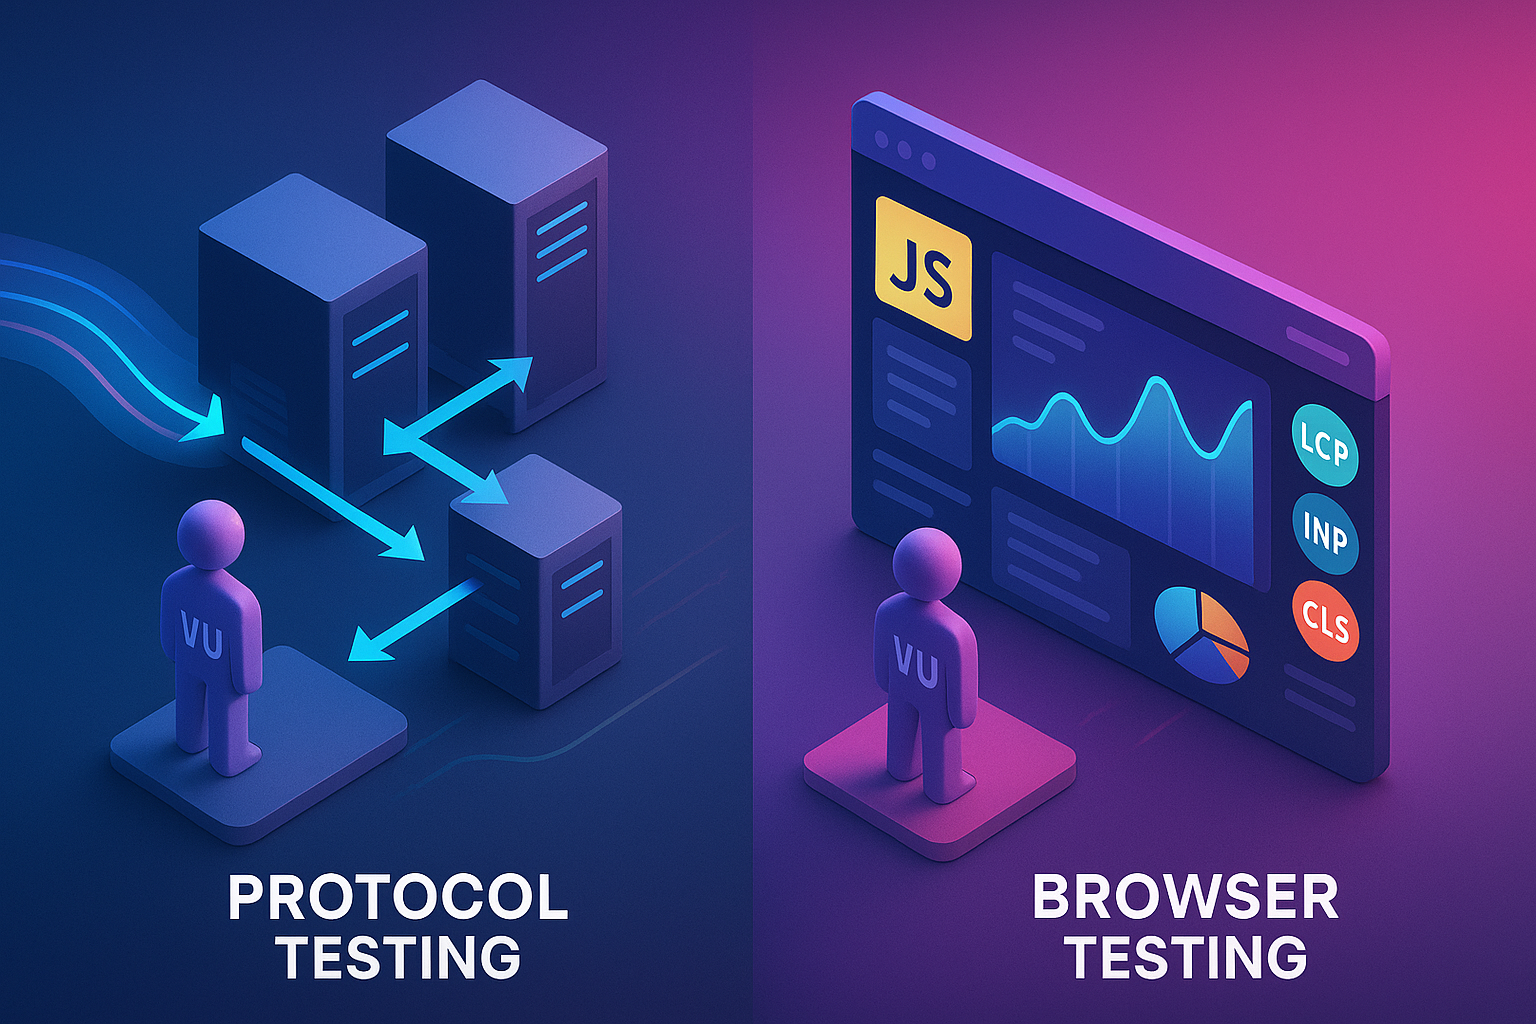
The hybrid approach uses protocol VUs for the high-volume backbone – simulating thousands of API calls, authentication flows, and background data sync – while a targeted 10 – 20% subset of browser-driven VUs simultaneously executes the critical user journeys that require real rendering validation. Both VU types execute under a single test controller, correlated by timestamp and load phase.
Performance Engineer’s Insight: “The hybrid model isn’t a compromise – it’s a deliberate architecture. You use protocol VUs to stress the backend at scale and browser VUs to validate that the frontend holds up under that stress. They answer different questions simultaneously.”
Nicole van der Hoeven’s independent analysis of hybrid load testing architectures[5] validates this approach as the practitioner consensus for balancing realism with scalability.
Designing Your Hybrid Test: Which Journeys Get Browser VUs?
Not every transaction warrants a full browser instance. Use this triage checklist:
- Significant client-side rendering (cart updates, dynamic search results, data visualization charts) → Browser VU
- Heavy JavaScript execution (SPA route changes, complex form validation, real-time calculations) → Browser VU
- Third-party script exposure (checkout pages with payment widgets, pages with analytics/advertising tags) → Browser VU – given that 92% of web pages include third parties[3], checkout and landing pages are near-certain candidates
- Pure API interactions (authentication tokens, background data sync, webhook processing) → Protocol VU
- Static asset loading (CDN-served images, CSS files, font downloads) → Protocol VU
A typical e-commerce hybrid test might allocate 50 browser VUs to the browse → search → add-to-cart → checkout journey, while 450 protocol VUs simulate the broader traffic patterns – product API calls, inventory checks, session keep-alives – that create the backend load context. For comprehensive guidance on best practices for testing web applications under this kind of mixed workload, applying these allocation principles early prevents costly redesigns.
Network Emulation and Cross-Browser Validation in Hybrid Scenarios
Two configuration dimensions that separate professional browser performance tests from amateur ones:
Network emulation: Throttle browser VUs to match real-world conditions. Mobile 4G profiles (~20Mbps down, 10ms RTT) reveal whether your LCP stays under 2.5s on typical mobile connections. Slow 3G profiles (~1.5Mbps down, 300ms RTT) expose critical failures for users in bandwidth-constrained environments. Google’s 75th percentile measurement guidance[1] means your CWV pass rate should account for the slower quarter of your user base – network emulation makes this testable before production.
Cross-browser execution: JavaScript engines differ. V8 (Chrome), SpiderMonkey (Firefox), and JavaScriptCore (Safari) handle memory allocation, garbage collection, and CSS animation rendering differently under pressure. A charting library that runs smoothly in Chrome’s V8 engine may trigger longer garbage collection pauses in Firefox under memory pressure, causing CLS violations in one browser that don’t appear in another[6]. Running the same browser-driven journey across Chrome, Firefox, and Edge within a single test run surfaces these inconsistencies before users encounter them.
Common Browser Performance Bottlenecks – and How to Find Them Under Load
A diagnostic reference section structured around the four most impactful browser performance bottlenecks practitioners encounter in real load testing programs. For each bottleneck, follow a consistent three-part pattern: (1) what it is and why it happens, (2) the specific metric signature that identifies it in WebLOAD’s browser-level reports, and (3) the targeted fix – with a note on how to validate the fix via retesting. This section transforms the article from informational to genuinely actionable, addressing the pain point that ‘load tests pass but real users still experience slow pages.’
Bottleneck 1: JavaScript Execution Blocking Rendering
What happens: Synchronous JavaScript on the main thread blocks the browser’s rendering pipeline. Under load, server response times increase, and render-blocking scripts that arrive later compound the delay. A 200ms synchronous form validation handler that was invisible at low traffic becomes an INP violation at 100 concurrent users as the event handler queue backs up.
Metric signature: JavaScript execution time elevated in the browser waterfall. INP values consistently above 200ms. Main thread utilization spikes above 80% during critical user interactions. domInteractive timestamps climbing – the parser is blocked waiting for script execution[2].
Fix and validate: Code splitting via dynamic import() to defer non-critical modules. Add async or defer attributes to non-essential scripts. Move CPU-intensive computation to Web Workers. Retest with browser VUs to confirm INP drops below 200ms at the same concurrency level.
Bottleneck 2: Third-Party Scripts Degrading Load Experience
What happens: Analytics tags, advertising scripts, consent management platforms, and chat widgets load asynchronously but still consume main thread time. Their performance is environment-dependent and outside developer control. The HTTP Archive Web Almanac 2024 – authored by Tobias Urban, Yash Vekaria, Zubair Shafiq, and Chris Böttger – found that “more than nine-in-ten web pages include one or more third parties” and that “the top 3 third-party content types include script (30.5%), image (26.0%), and html (11.7%)”[3].
Metric signature: In the browser waterfall, third-party domain requests appear with disproportionate execution times. A single consent management platform script can add 400 – 800ms to LCP on mobile network profiles. LCP degrades more severely on throttled connections because third-party scripts compete with first-party resources for bandwidth.
Fix and validate: Audit third-party tags using the browser waterfall filtered by request origin. Defer non-critical scripts below the fold. Use facade patterns for chat widgets (load a static placeholder; initialize the widget only on user interaction). Set a third-party script budget – e.g., total third-party JS execution must stay below 300ms. Crystallize’s analysis of third-party script costs[7] provides additional quantification methodology. Retest with browser VUs to confirm LCP improvement.
Bottleneck 3: Inefficient DOM Manipulation in SPAs
What happens: SPAs that perform excessive DOM mutations – re-rendering large component trees on every state change, triggering forced synchronous layouts, maintaining thousands of active event listeners – create compounding problems under load. Layout thrashing occurs when code reads a layout property (offsetWidth), writes a style (style.width = '100px'), then reads again in a loop – forcing the browser to recalculate layout on every iteration instead of batching operations.
Metric signature: CLS above 0.1 during route transitions – Google’s threshold for good user experience[1]. An infinite scroll implementation inserting DOM nodes above the viewport can push CLS above 0.25. Elevated domComplete times across concurrent browser VU sessions. Memory consumption growth across session duration – a signal of DOM node accumulation or event listener leaks.
Fix and validate: Implement virtualized scrolling (render only visible rows). Batch DOM reads and writes to avoid layout thrashing. Use requestAnimationFrame for visual updates. Run browser VUs with session durations of 10+ minutes to surface memory-related degradation that short tests miss.
Real-World Scenarios: What Browser Performance Testing Uncovers in E-Commerce, SaaS, and Financial Applications
Four concise scenario vignettes – intentionally shorter and more narrative than the surrounding sections – illustrating what browser-level load testing surfaces in real application domains. Each vignette follows the pattern: application type → specific user journey → the bottleneck that protocol tests missed → the browser metric that exposed it → the fix. These are not hypothetical – frame them as representative patterns from enterprise testing programs. This section gives the article practitioner credibility and breaks the structural uniformity of the longer tutorial sections.
E-Commerce: When Cart Updates and Dynamic Pricing Hide the Real Performance Problem
In a typical e-commerce load test, protocol scripts validate the add-to-cart API at 200ms p95 and declare the checkout flow healthy. Browser VUs running the same journey simultaneously reveal the client-side cart update animation triggering a 380ms JS execution event – INP: 380ms, failing the 200ms threshold. On the checkout page, a third-party payment widget adds 600ms to render completion – LCP: 3.1s, failing the 2.5s threshold[1]. Scripts account for 30.5% of third-party content types[3], and payment widgets are among the most common script-type third parties on checkout pages. Neither metric appeared in the protocol results.
SaaS Dashboards and Financial UIs: The Real-Time Rendering Challenge
SaaS dashboards with WebSocket-driven visualization components reveal a different failure pattern. When multiple chart components update simultaneously under 30+ concurrent browser VUs, accumulated DOM mutations produce CLS > 0.15 as chart containers reflow. The issue requires session durations of at least 5 – 10 minutes to surface – short-duration tests miss the memory growth trajectory.
Financial trading UIs push the pattern further: real-time market data feeds driving hundreds of DOM updates per second cause layout thrashing and INP violations exceeding 400ms during simulated peak trading data bursts. domComplete times climb steadily across the session as DOM complexity accumulates[2]. Protocol scripts monitoring the WebSocket feed latency report 8ms delivery times and see nothing wrong. For strategies on systematically surfacing these kinds of issues, see how to test and identify bottlenecks in performance testing.
Implementing Browser Performance Testing with WebLOAD: A Setup Checklist
A deliberately checklist-oriented section – distinct in format from the narrative and tutorial sections – providing a practical implementation reference for teams setting up browser performance testing in WebLOAD for the first time or formalizing an existing ad-hoc practice. Organized as a pre-test checklist, an execution checklist, and a post-test analysis checklist. This format gives time-constrained practitioners (QA leads, DevOps managers) an immediately actionable reference they can bookmark and return to.
Pre-Test: Defining Scenarios, Selecting Metrics, and Allocating Resources
Cover the planning phase checklist items: identifying critical user journeys for browser VU coverage using the triage framework from earlier; selecting the browser-level metrics to track (minimum: LCP, INP, CLS, domInteractive, JS execution time, memory per session)[1][2]; sizing load generator infrastructure based on planned browser VU count; and validating Selenium script readiness (no hard sleeps, parameterized data, clean session isolation). Include a note about establishing baseline single-user browser performance benchmarks before scaling to concurrent load.
Budget 512MB – 1GB RAM per concurrent browser VU; a load generator with 16GB RAM can sustain approximately 16 – 32 browser VU instances depending on application complexity. For the full metrics reference, see our essential-load-testing-metrics-engineers-guide-kpis.
Post-Test: Analyzing Browser Metrics and Translating Findings into Fixes
Guide practitioners through the post-test analysis workflow: reading the browser waterfall to identify the slowest resource categories (JS, CSS, images, third-party); correlating browser metric degradation (rising LCP, INP violations) with concurrent VU count to identify the load threshold at which browser experience breaks; isolating third-party script contributions by filtering the waterfall by request origin; and documenting findings in a structured format (metric baseline, load-threshold failure point, root cause, recommended fix, retest target). Emphasize the retest-and-validate cycle.
Plot LCP p75 against concurrent browser VU count to identify the inflection point – e.g., LCP stays below 2.5s up to 50 concurrent users but spikes to 4.1s at 75 concurrent users, indicating a CDN or JS execution scaling limit. See MDN Web Performance Documentation for a supplementary optimization reference.
Frequently Asked Questions: Browser Performance Testing
What Is the Difference Between Browser Performance Testing and Load Testing?
Browser performance testing measures client-side user experience inside a real browser – LCP, INP, CLS, DOM rendering time, JavaScript execution duration. Load testing (protocol-level) measures server-side capacity: requests per second, error rates, p95 response times under concurrent user volume. A protocol load test confirms your servers handle 5,000 concurrent connections; a browser performance test confirms users can actually interact with the page when those connections arrive. The hybrid approach runs both simultaneously.
Can You Use Selenium for Performance Testing?
Not alone. Selenium controls one browser session at a time and has no concurrent VU orchestration, no statistical aggregation across sessions, and no network condition emulation[8]. However, when embedded inside a load testing platform, Selenium scripts become the browser-execution layer for performance scenarios. WebLOAD imports Selenium scripts and scales them to N concurrent browser VU instances with full metric aggregation – turning functional automation into performance validation without rewriting scripts. See the Official Selenium Test Practices Documentation for Selenium’s intended scope.
What Are the Most Important Browser Performance Metrics?
For user experience: LCP ≤ 2.5s, INP ≤ 200ms, CLS ≤ 0.1 – Google’s Core Web Vitals, measured at the 75th percentile[1]. For technical diagnosis: TTFB, domInteractive, domComplete, and JavaScript execution time[2]. For load testing specifically: track these at p75 and p95 across concurrent browser sessions to identify the concurrency threshold where experience degrades. Learn more at Core Web Vitals Learning Resources (web.dev).
How Do You Test Browser Performance Under Load?
Configure browser-driven virtual users using Selenium scripts for your critical user journeys. Set a ramp-up profile (e.g., add 1 browser VU every 5 seconds up to 50 total), apply network emulation profiles matching your real user base, and track Core Web Vitals and Navigation Timing metrics across all concurrent sessions. Identify the load threshold at which browser metrics degrade past acceptable thresholds. Combine browser VUs (10 – 20% of total) with protocol VUs (80 – 90%) for the hybrid model that delivers both backend stress and frontend fidelity.
What Tools Support Browser-Level Load Testing?
Browser-level load testing requires concurrent full-browser VU orchestration, browser-specific metric collection (Core Web Vitals, DOM timing, JS execution), and Selenium/WebDriver integration. WebLOAD by RadView provides native Selenium integration at scale alongside 150+ protocol types – enabling the hybrid protocol/browser architecture in a single ecosystem. Some SaaS-based platforms offer cloud-hosted browser testing with higher per-VU cost structures but typically lack the hybrid model. Open-source tools can be configured for browser execution but require significant manual orchestration for concurrent VU management and metric aggregation.
References
- Walton, P. (2024). Web Vitals. web.dev (Google Chrome team). Last updated October 2024. Retrieved from https://web.dev/articles/vitals
- Weiss, Y., & Rosenthal, N. (Eds.). Navigation Timing Level 2. W3C Working Draft. W3C Web Performance Working Group. Retrieved from https://www.w3.org/TR/navigation-timing-2/
- Urban, T., Vekaria, Y., Shafiq, Z., & Böttger, C. (2024). Third Parties. 2024 Web Almanac, HTTP Archive. DOI: 10.5281/zenodo.14193384. Retrieved from https://almanac.httparchive.org/en/2024/third-parties
- Osmani, A. (N.D.). Identify Slow Event Handlers with the Long Tasks API. web.dev (Google). Retrieved from https://web.dev/articles/long-tasks-devtools
- van der Hoeven, N. (N.D.). Hybrid Load Testing. Personal knowledge base. Retrieved from https://notes.nicolevanderhoeven.com/Hybrid+load+testing
- T-Plan. (N.D.). Common Cross-Browser Incompatibilities in Web Apps. T-Plan Blog. Retrieved from https://www.t-plan.com/blog/common-cross-browser-incompatibilities-in-web-apps
- Crystallize. (N.D.). The Cost of 3rd Party Scripts. Crystallize Blog. Retrieved from https://crystallize.com/blog/cost-of-3rd-party-scripts
- SeleniumHQ. (N.D.). Test Practices – Selenium Documentation. The Selenium Project. Retrieved from https://www.selenium.dev/documentation/test_practices/