Selenium is used by many companies ranging in size from small startups (app / game developers) all the way up to enterprise sized companies. Its users have discovered that the investment in creating functional tests based on Selenium has become so significant that it is now a staple in the load testing toolkits of many companies. Running Selenium means executing tests while running a real browser – providing significant feedback when combined with load testing.
Load Testing on other hand, is solely focused on creating mass load, and therefore to be effective it works on the protocol level. Since it is trying to test the server side, simulating many clients, the client itself is less important to these kind of tests. In other words, if you can minimize the footprint of the client to create an effective load on the server you will succeed in creating more load from a single server. This is why load testing products work solely on the protocol level.
The Round Trip Ticket of Load Testing
When you load test your servers the aim is to receive a clear answer regarding the user’s usage behavior – not only how the server itself behaves. What we really want to learn is – What was the whole round trip of a request that started with a user’s click in the browser, continuing with the request and the response with / from the server, and ending by rendering the response on the client browser.
Add Functional Testing To Your Load Testing!
Mixing both functional testing and load testing is a powerful combination that massively reduces performance risk and gives you more information of critical issues that could impact your servers.
Let’s combine both functional testing and load testing in a way that during the effective load that is being done via simulation of protocols, you can run a few browsers from different locations and measure their activity. You will not make the load via the browser’s. This will be a resource intensive task as it will require too many machines running browsers. The idea is to combine an effective load on one hand, with a few browsers measuring the real activity on the other hand.
Let’s see what happens when we do this in WebLOAD.
You can use the scripts that you already have for your functional tests, and keep your investment, but you can also create a new script dedicated to the load testing since WebLOAD gives you the following 2 options for creating a Selenium script that is executed in WebLOAD:
- Record a script in Selenium and using the WebLOAD plug-in in Selenium, make it ready for WebLOAD. Tip: When recording a script you can create both Selenium scripts and WebLOAD scripts in parallel. While recording in Selenium you can activate WebLOAD proxy recorder. Now you can be sure that the same scenario is being created by both tools.
- Code it yourself in WebLOAD IDE – We understand that many users like to code their Selenium scripts. So this option will be welcomed by many users as well.
Let’s take a look at some screenshots to get a better feel for what is happening here.
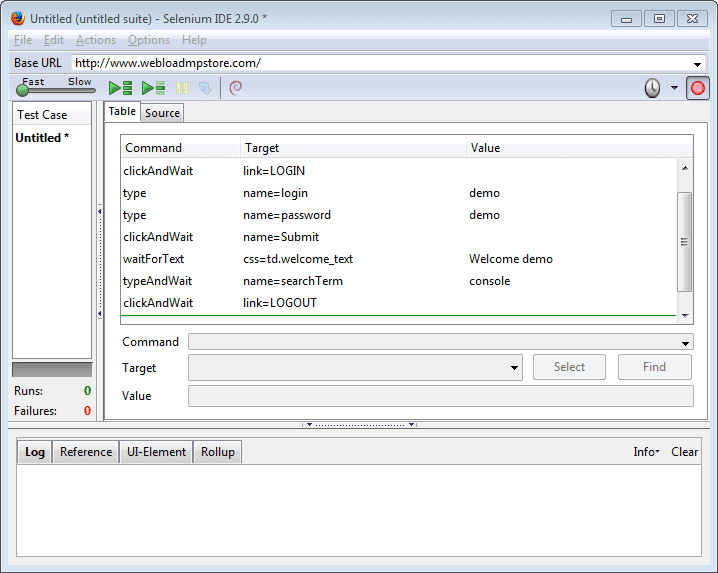
You first start with recording via Selenium. This is purely regular Selenium work.
Selenium Application During Recording
After you are satisfied with your script you can save it to WebLOAD. We developed a plugin for Selenium in WebLOAD that lets you save the script in JavaScript to be executed in WebLOAD.
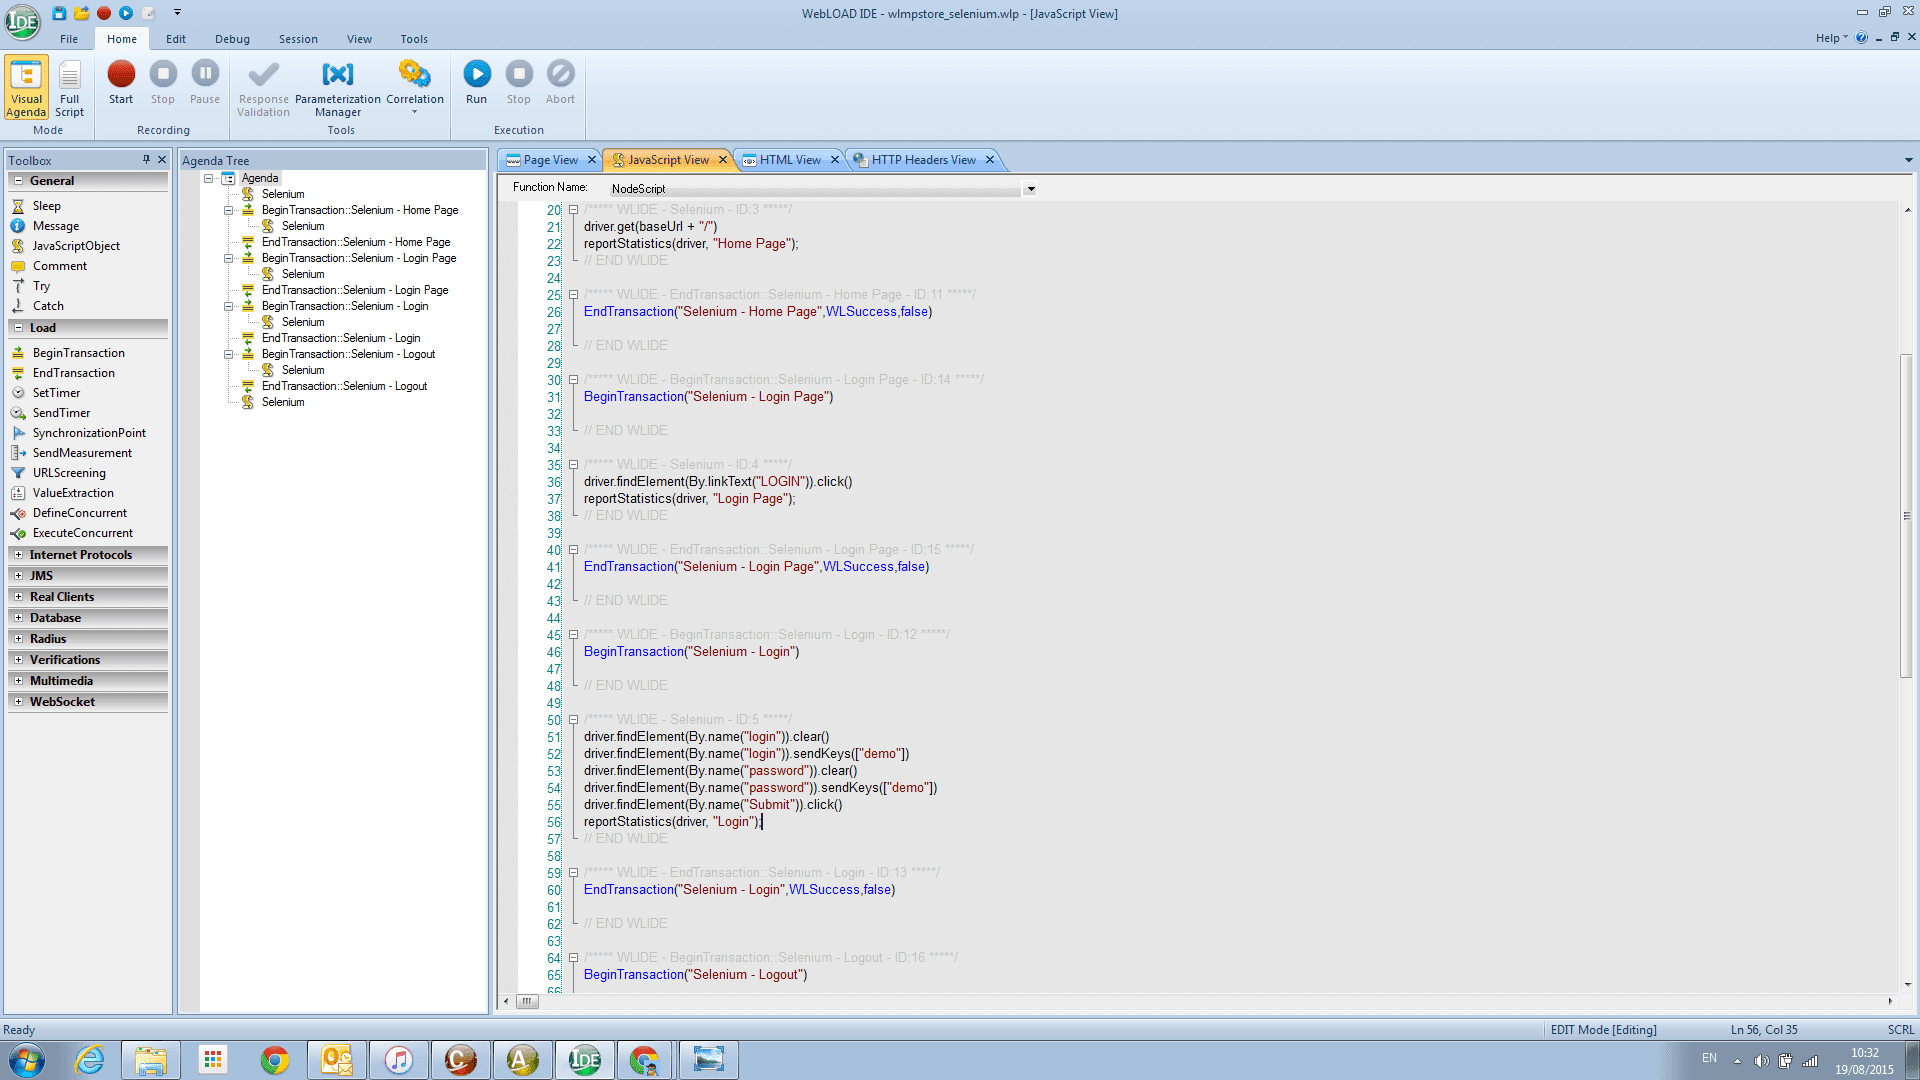
After the Selenium script is saved, you can open it in WebLOAD. Of course, you can make your changes to the script, add WebLOAD transactions, report statistics for a certain page, etc.
Selenium Script in WebLOAD IDE
Running the load test with a Selenium script in WebLOAD allows it to function the same as it would if it were a standard WebLOAD script. In other words, users do not need to worry about compatibility issues and potential hiccups in the system as a result of a script created in Selenium. The best way to configure it is to execute the real simulation load in a Load Generator, and to execute the Selenium script in the probing client – that means running only one client that runs one browser on a single machine – in other words we are measuring the activity of a real user.
As for the statistics, WebLOAD implementation of Selenium was enhanced to collect performance statistics from the browser. This feature in addition to the obvious WebLOAD Transactions can help you understand the user experience of a page loaded in the browser. Beside the overall users experience of a whole page, it can give you detailed information on browser rendering time and DOM interaction, DNS time, time to first byte, etc.
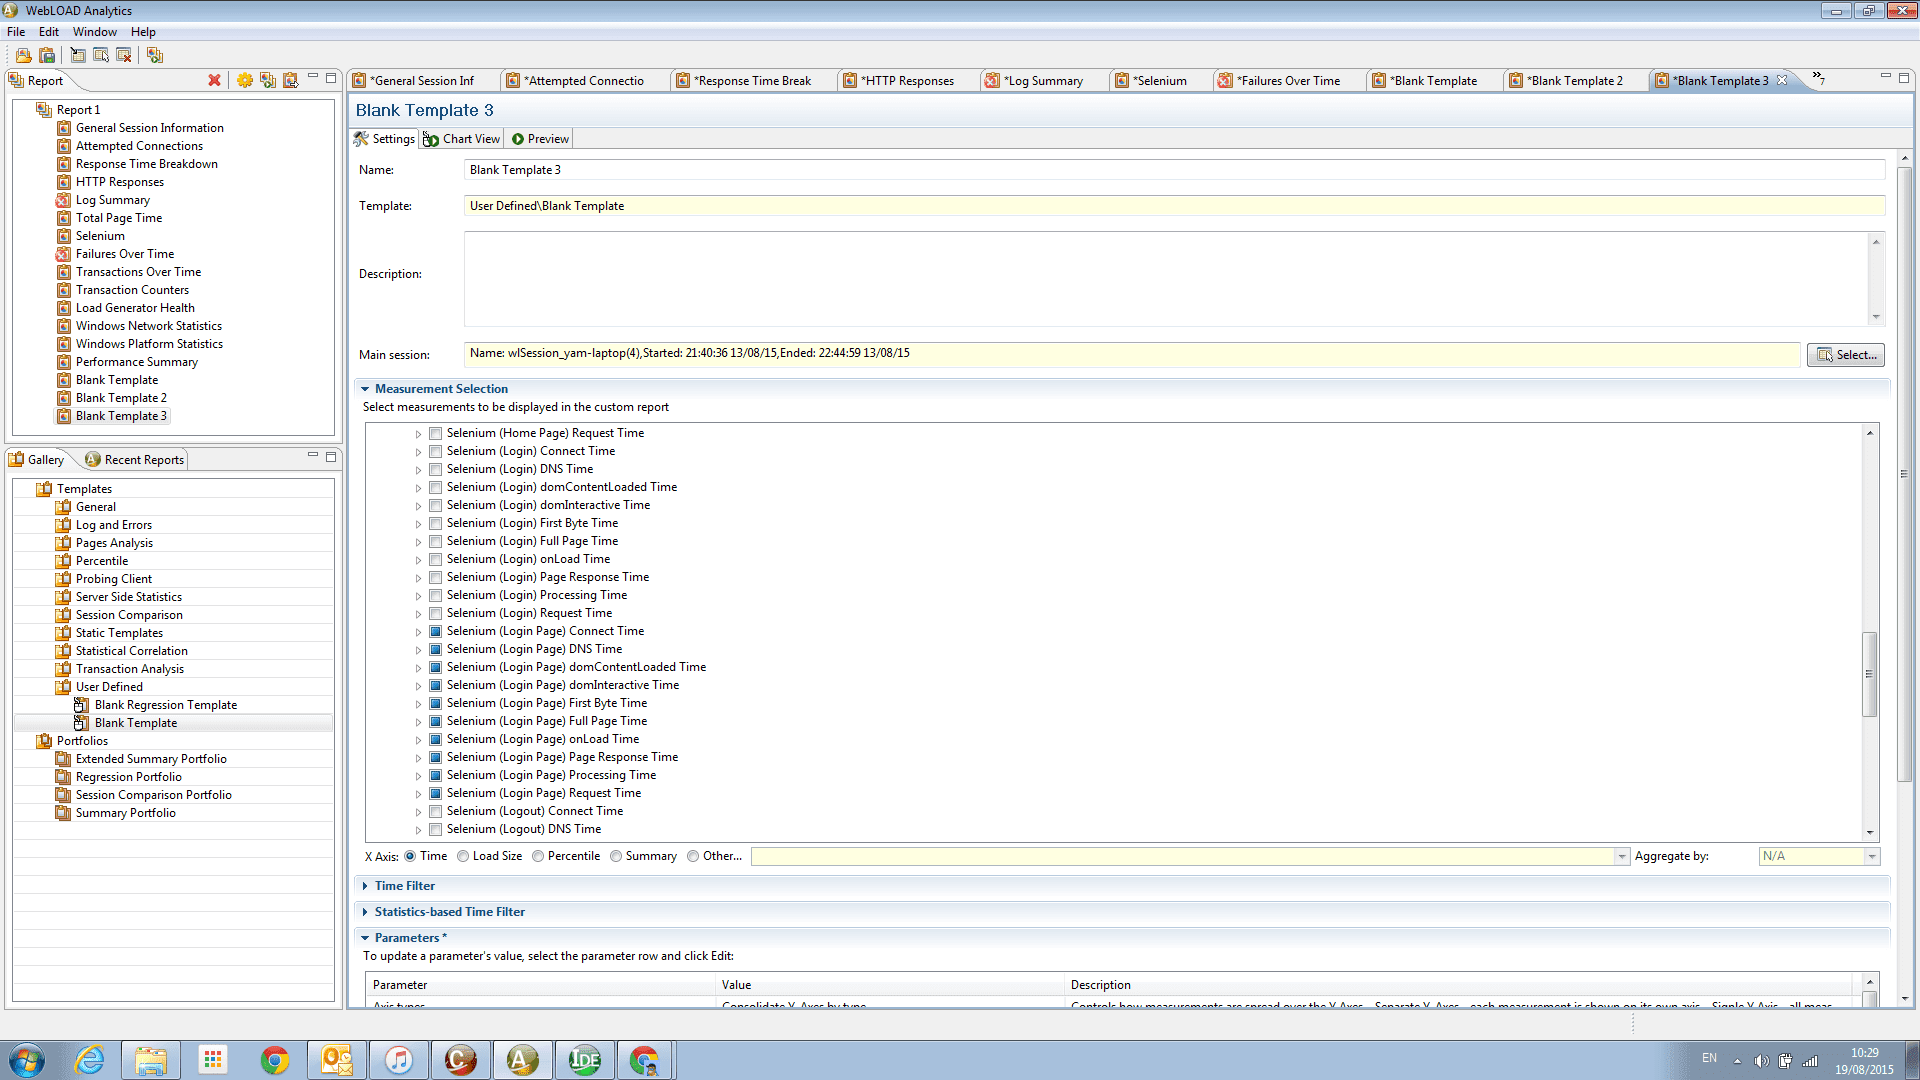
You can configure your Selenium script so it will collect information for each page separately in addition to the default overall statistics collection. This can give you a powerful selection of statistics to be presented in WebLOAD.
Selenium Measurements in Analytics
You will analyze these statistics accordingly, similarly to all WebLOAD results via WebLOAD Console, WebLOAD Analytics and WebLOAD Dashboard.
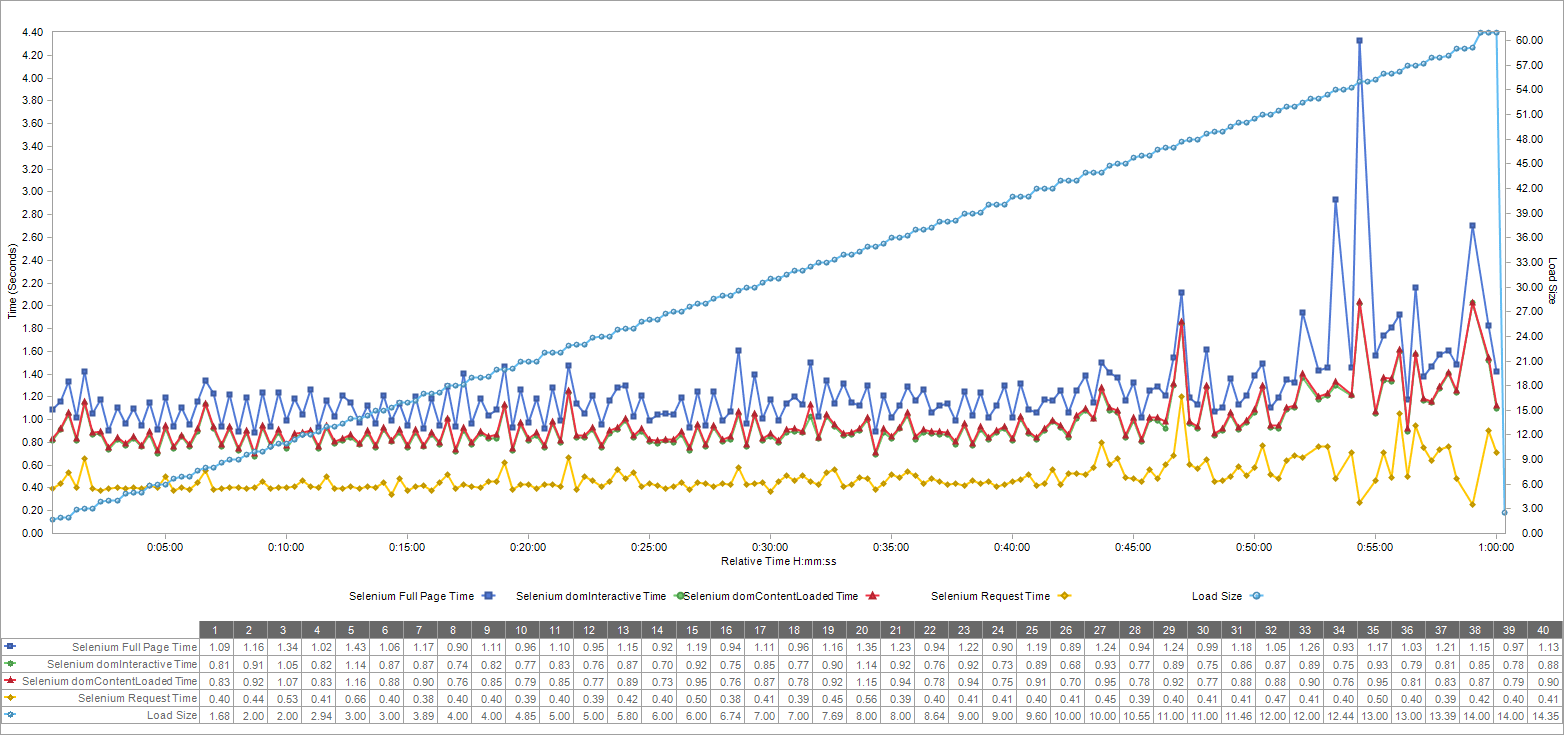
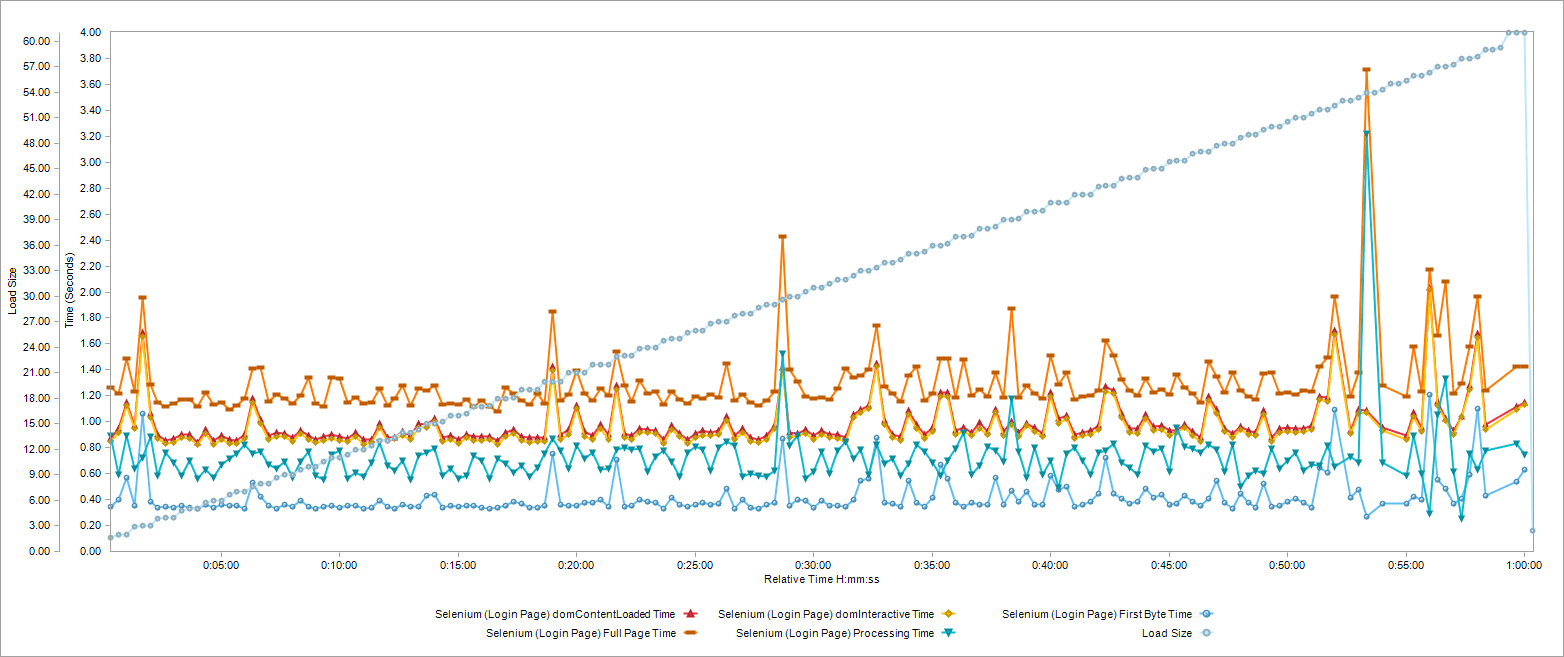
In the following image, you can see statistics that were collected for all pages, while in the next image you can see detailed browser statistics for a single page.
Selenium Measurements Chart with Load Size
Selenium Measurements Chart for Specific Page with Load Size
Now you have seen for yourself what happens when you mix functional and load testing. You can get interesting information of the real browser user experience during load, and even get detailed performance information of internal work being done by the browser. Ultimately this will result in tests that produce results that are truly in line with a real world user experience.
Selenium (functional) testing gives you the user experience. Load testing enables you to identify your server’s bottlenecks and push it to the limit. Working together, Selenium and load testing are a powerful pair.
<!- [downloadform] –>


