
Here’s a fact of life: whatever number of reports and graphs is provided by your load testing tool – you’ll always be missing the one you’re after.
Which is why we invested lots of efforts in the WebLOAD Dashboard – make it as easy as possible to customize your own analysis dashboards in seconds. Using the WebLOAD Dashboard you can create any number of customized dashboards, save and share them with colleagues.
If you’re not familiar yet with the WebLOAD Dashboard you can start with one of the resources below, or else skip and read below about its customization options.
User Management and Permissions
The full WebLOAD installation installs the WebLOAD Dashboard web server by default. Start the server by selecting “Start WebLOAD Dashboard” via the control panel. Then, access WebLOAD Dashboard via “http://[machine]:3000/”.
You can login using the default admin/admin. Additional users can be added using one of two methods:
- The admin user can add them via admin->Users
- Users can self signup by themselves. Any signup user will get viewer permission. This behavior can be disabled in configuration.
You can set permissions to view only, customization, executing tests, upload tests, etc.
Creating Your Own Dashboard
Although the tool is called the ‘WebLOAD Dashboard’, it is in fact, a set of multiple dashboards. This includes ready-made, or default dashboards such as ‘Main Dashboard’, ‘Transaction details’, ‘Log dashboard’, as well as a special dashboard called “Customizing the dashboard”. This dashboard guides you through the process of building your own customized dashboard.
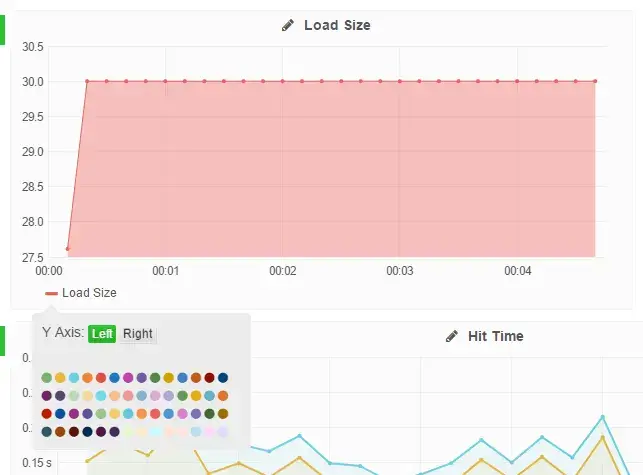
While you cannot change the ready-made dashboards, you can use them as a basis to create a new dashboard. Open the the ‘Main dashboard’ and click on the color of the legend in the load size panel. Change the color.
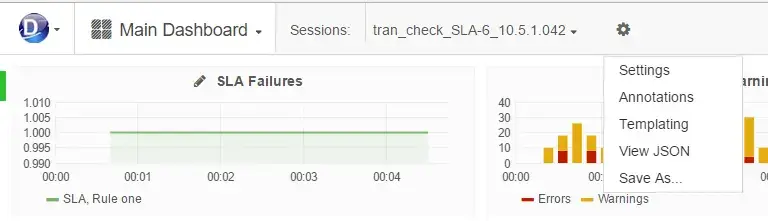
Now save the dashboard with a new name by clicking on the ‘manage dashboards’ icon and clicking “Save As…”.
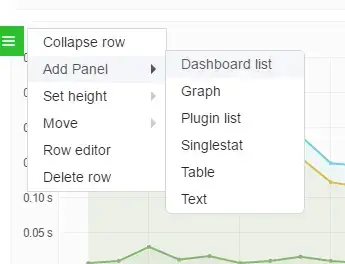
- Adding rows. A dashboard is designed using rows and panels. To add a row click the bottom, ‘Add Row’ button.
- Adding a panel is done via the green marker that appears to the left of each row. You can add several types of panels – a graph, where you view measurements over time, or a Singlestat, which presents a single number that summarizes a measurement within the presented timeline. For example, Count of ‘Attempted Connections’ – this number is changed and presents the relevant count when you zoom in/out to a specific time frame.
- Updating a panel. Edit a panel by clicking the panel icon next to the panel name.
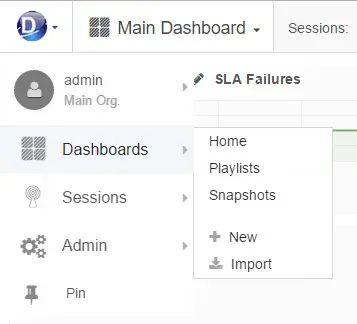
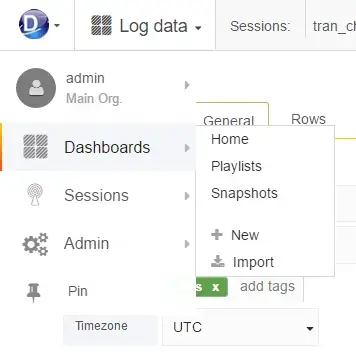
- Add a dashboard by clicking the Dashboard icon on the left and selecting New.
- Change dashboard settings. You can ‘play’ with each dashboard and adjust it to your needs by clicking the Settings option.
Copying a dashboard from a different environment
You can copy a dashboard from one environment to a different dashboard server, without the need to configure it from scratch.
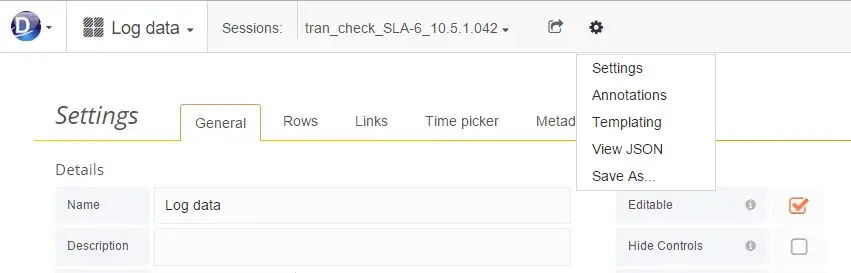
Start by viewing the original JSON definition using the ‘View JSON’ button under the ‘manage dashboards’ icon. Copy the entire JSON code. Then go to your second WebLOAD Dashboard server, and ‘import’ a dashboard, pasting the JSON you copied earlier, or upload a JSON file.
Viewing Session Results
Using the WebLOAD Dashboard you can view session results – whether a session has completed running or is currently running.
- To view a session that completed running, first upload using the Sessions>Upload button.
- To enable viewing running sessions, first configure the WebLOAD Console so that it writes data to the Postgres DB during test execution.
Open the WebLOAD Console and go to Tools -> Global options -> Database. Activate the checkbox ‘Insert Statistics into PostgreSQL DB during the session’.
You can view either the results of a single session, or else multiple sessions at once, with results displayed side-by-side. In the sessions drop-down menu, select the session(s) you want to view.

Different Dashboards for Different organizations
Different groups or teams can have different ‘Organizations’ in the WebLOAD Dashboard. Each organization has it’s own dashboards and can be configured to use a different WebLOAD instance. Users can belong to more than one organization and have different roles in them.
To create an organization, an administrator would use the ‘New Organization’ button, and then assign users to that organization. Users that belong to more than one organization can switch between organizations from the side menu.
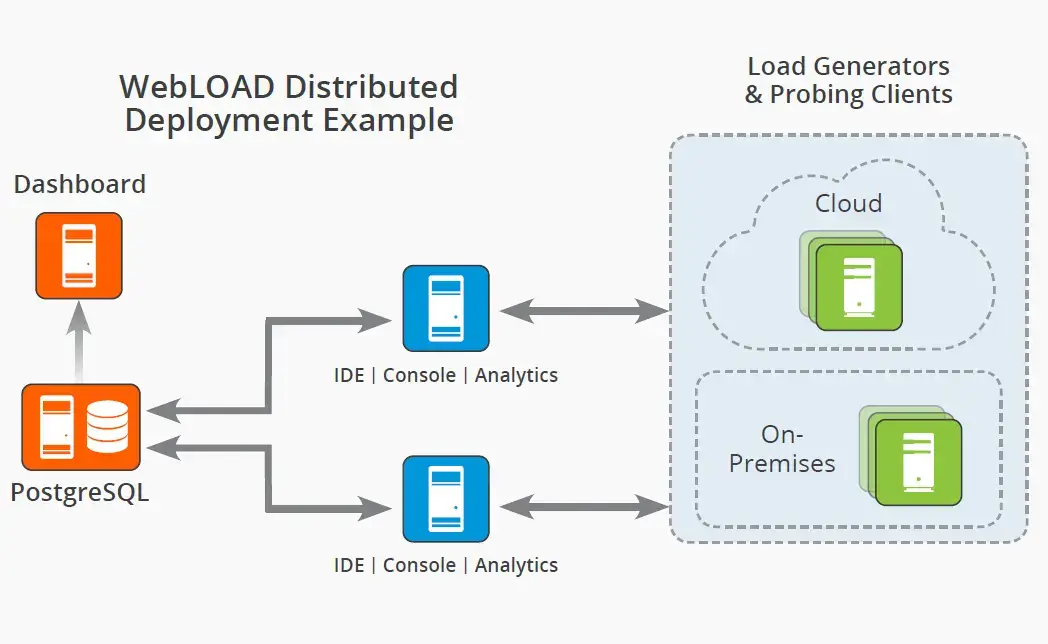
A Single WebLOAD Dashboard for Multiple Consoles
By Default, the WebLOAD Dashboard is installed as part of the WebLOAD Console. But you can also define a centralized machine to host the WebLOAD Dashboard so it will serve multiple WebLOAD Consoles. This way, you can analyze all your tests in one place, no matter which WebLOAD Console was involved in the test.
This is illustrated in the diagram below where a single WebLOAD Dashboard in a distributed architecture serves two WebLOAD Consoles.